-1.jpg)
Welcome to the summary of the August 2020 edition of the Xeneta Shipping Index (XSI®) for the contract container market. Here is a snippet of how the long-term container market has moved in the 8th month of 2020.
Despite the economic shockwaves brought on by the ongoing global pandemic, the world’s leading carriers continue to display signs of effective strategic management skills.
Many of the industry’s key players are posting robust Q2 results, and our latest XSI® Public Indices report notes global rates are still holding firm, with August registering a 1.8% decline after an increase of 0.1% in July. This means rates are now just 2.2% down year-on-year – a figure that, given the impact of coronavirus on economic activity, is “surprisingly small.”
XSI® - Europe Imports / Exports
Imports on the European XSI® slipped by 0.7% this month to 110.00 points, with the index falling by 8.4% since the all-time high of 120.04 recorded back in Feb-20. Year-on-year, the benchmark is 1.2% lower and it has declined by 4.5% since the end of 2019. European exports also fell in Aug-20, declining by 3.0% to 114.99.
With Golden Week fast approaching, rates on the key Far East - North Europe trade could increase further due to planned FAK adjustments and Peak Season Surcharges (PSS) due to come into force. There remain questions over how quickly European economies and therefore demand recovers, particularly in the face of newbuild deliveries.
XSI® - Far East Imports / Exports
Far East imports on the XSI® fell by 4.1% in Aug-20 to 96.65 points and are down by 2.4% year-on-year. The benchmark has declined by 2.0% since the end of 2019 and while still above the all-time low of 93.83 reported in Oct-19, this could be surpassed if the current trend continues. Exports on the XSI ®developed more favorably this month, albeit they rose by just 0.1% to 119.15 points. While the index is 2.1% lower than the equivalent period of 2019, it remains up 0.5% since the end of last year.
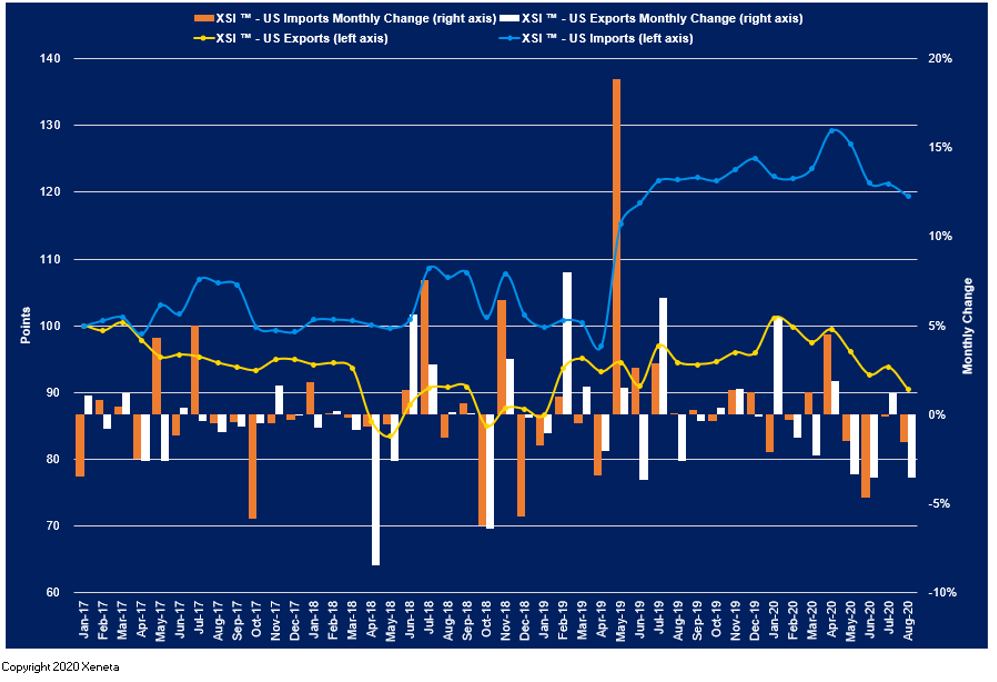
XSI® - US Imports / Exports
US imports on the XSI® declined by 1.5% in Aug-20 to 119.44 points, with the benchmark down by 2.0% compared to the same period of 2019. Since the all-time high of 129.20 reported in Apr-20, the index has fallen by 7.6% and it has declined by 4.5% since the end of 2019. Exports have also fallen, with the index down 3.5% this month to 90.52. Year-on-year, US exports are 4.2% lower and have fallen by 5.6% since Dec-19.
Get the full August 2020 XSI report (PDF) with all the market movement graphs here.
MEDIA: Please have a look at the press release here.
---