-1.jpg)
The August 2019 Xeneta Shipping Index public update and commentary on the long-term market is now available. Here is a snippet of how that market has moved so far in June on the main trade corridors.
Excerpt below. Get the full August 2019 XSI® report (PDF) with all graphs here.
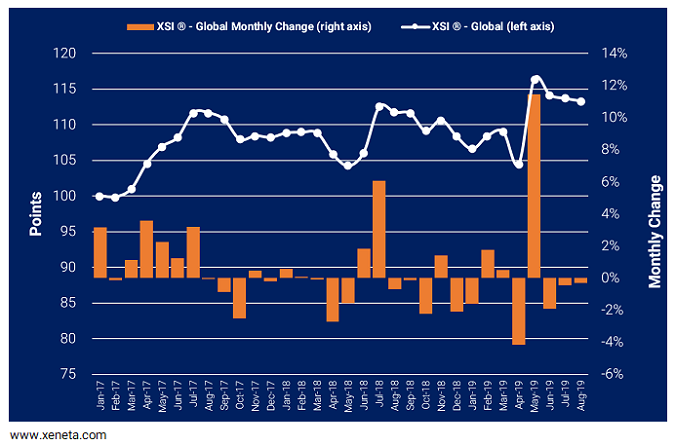
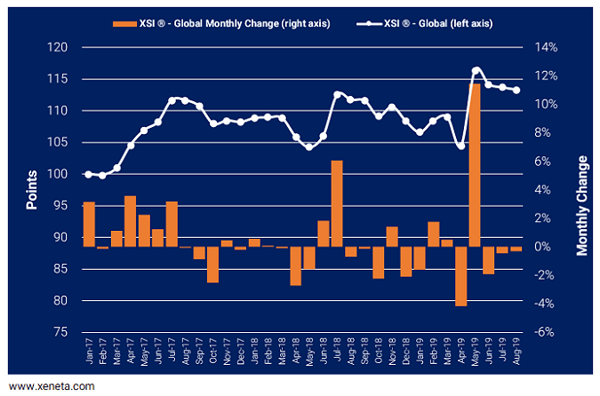
The global XSI ® fell 0.3% in August to 113.32 points and has now declined by 2.7% since the all-time high of 116.43 reported in May-19. Despite this month-on-month fall, the benchmark remains 1.4% higher than the equivalent period of 2018 and is up 4.6% since the end of last year.
XSI® - Europe Imports / Exports
European imports on the XSI ® were unable to maintain last month's momentum and fell by 1.4% to 111.32 points. The index remains at a comparatively high level and is 2.5% higher than the same period of 2018, while it is up 1.7% since the end of last year.
On the key Far East-North Europe trade, carriers have been unable to capitalize on the rate increases implemented at the start of the month, despite a series of blanked sailings. There have also been anecdotal reports that carriers have been using the threat of rollovers to try and secure higher rates, however, rate reductions from September 1st suggest the tactic has been unsuccessful. Moreover, such aggressive short-term tactics may backfire, if when new IMO regulations come into force fundamentals remain weak.
XSI® - Far East Imports / Exports
Far East imports on the XSI ® remain in the doldrums and declined by a further 0.1% month-on-month to 99.05 in Aug-19. While much of the year-on-year decline can be attributed to a substantial fall reported in May-19, the XSI ® is down 17.1% compared to this time last year and has fallen 12.7% since the end of 2018.
XSI® - US Imports / Exports
US imports on the XSI ® continued to rise in Aug-19, increasing by 0.1% to 121.88 points, thereby setting another all-time high for the index. Since the end of 2018, the benchmark has jumped 20.0% and it is 13.6% higher than the same period a year earlier.
Month-on-month developments for exports were less favorable, falling by 2.6% to 94.53. However, the index remains 4.1% higher than Aug-18 and has increased by 8.0% since Dec-18.
Don't miss out! Get your copy of the full August 2019 XSI report (PDF) with all graphs now. Xeneta Shipping Index Public .