
In the four weeks ending in mid-November, capacity on the Transpacific fell to its lowest level of the year, with an average of 242 700 TEU offered every week. Compared to July, when capacity offered on the Transpacific peaked, the offering has fallen by 25.8%, losing about eleven 8 000 TEU ships a week.
The alliance with the largest fall in capacity compared to July is the 2M alliance, which is down by 30%.
In contrast, the Ocean Alliance has increased its share of total capacity on the trade up to 34.1%. Its offerings have fallen less than the other alliances (-21.3%). Capacity sailing outside of alliances has also seen a considerable drop, down by 28.8% compared to July.
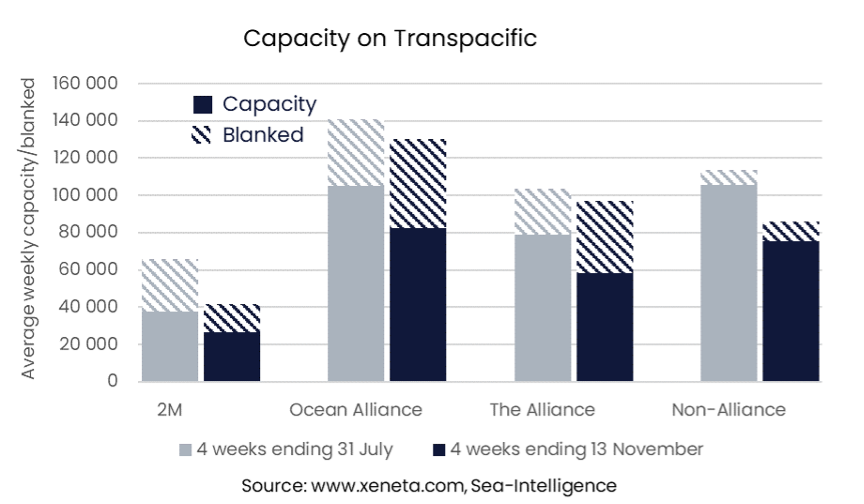
One of the reasons behind the fall in capacity is an increase in blank sailings. In the four weeks ending mid-November, an average of 112 000 TEUs were blanked on the Transpacific every week. The Ocean Alliance is blanking the most capacity (47 500 TEU a week), whereas only around 10 560 TEU a week of non-alliance sailings are being blanked.
Capacity has, however, fallen by more than what can be explained by blank sailings. Even in July, an average of 96 650 TEU was blanked every week.
Carriers are increasingly removing services in the face of lower demand. Canceling a whole service instead of a 'sailing' would mean the capacity will not be counted towards blanked sailings, as it will not appear at all.
There are several examples of carriers stopping services, especially the services they had started in the second half of last year when demand was high.
MSC, for example, added the non-alliance Puma and Mustang services in September last year. While earlier in the year, some sailings on these two trades were being blanked. The two services have now been altogether stopped and, therefore, no longer appear in the blank sailings statistics.
Non-alliance services were more likely to be added when the market rose. These are also the ones that are being removed at a faster pace than alliance services.
Considering the capacity that has been removed altogether, and not just blanked, non-alliance offerings have fallen by 28 000 TEU a week. This equates to more than 40% of the total capacity removed.
Note:
The 'Weekly Container Rates Update' blog analysis is derived directly from the Xeneta platform. In some instances, it may diverge from the public rates available on the XSI ®-C (Xeneta Shipping Index by Compass, xsi.xeneta.com. Both indices are based on the same Xeneta data set and data quality procedures; however, they differ in their aggregation methodologies.
Want to learn more?
Sign up today for our upcoming monthly State of the Market Webinar to stay on top of the latest market developments and learn how changing market conditions might affect your contract negotiations.
PS: Missed the LIVE session? Sign up to get the full webinar recording.