
On all the major trades out of the Far East, capacity in the past four weeks has been lower than in the corresponding four weeks last year. The most significant drop has come in capacity heading over from the Pacific towards the US West Coast. From 26 September to 23 October, this trade has also seen less capacity deployed compared to the same four-week period in 2019.
The average weekly capacity offered from the Far East to the US West Coast, from 26 September to 23 October, was 237 000 TEU. It is down by 23.2% from the same period in 2021 and is equivalent to removing nine 8 000 TEU sailings each week.
The huge amount of capacity added to the US West Coast at the end of 2020 and during 2021 is now being removed, thanks to blank sailings, extra loaders, and certain services being canceled. With so much capacity removed, the offered capacity on this trade is down by 13% compared to 2019. This shows that the congestion was building fast in the early COVID years but is easing considerably in 2022.
Read more below in Xeneta's weekly container freight update.
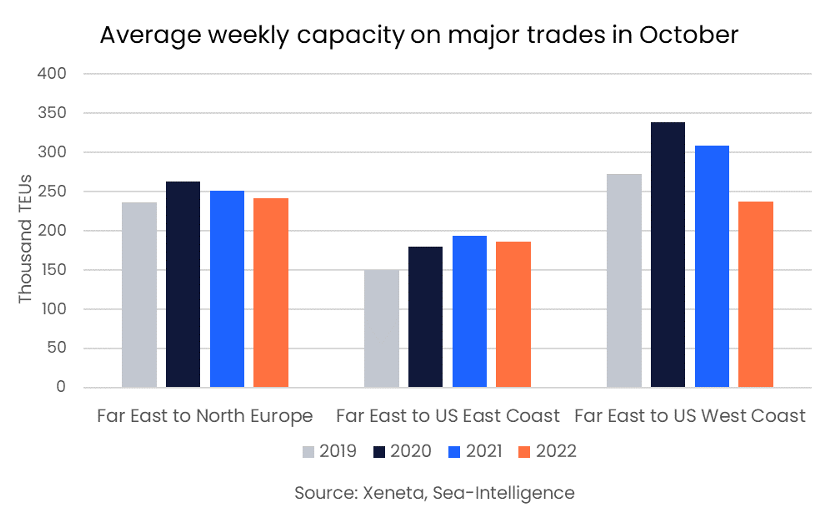
The fall in capacity compared to 2019 comes despite a 14% increase in container volumes in the first eight months of 2022 compared to the same period in 2019. Looking at only August 2019, 823 000 TEU were transported from the Far East to the US West Coast, lower than the 880 000 TEU moved this August. However, August demand this year is down from both 2020 and 2021.
Despite demand increasing year-on-year from the Far East to the US, East Coast capacity is also down year on year on this trade, having fallen to an average of 186 070 TEU per week in the past four weeks, down 3.9% from 193 711 in the same four weeks last year. Compared to the same period in 2019, the capacity offered is up by 36 000 TEU a week.
Capacity from the Far East to North Europe is also up this year compared to 2019 but lower than in both 2020 and 2021. Between 26 September and 23 October, an average of 241 400 TEU was offered on this trade, 10 000 TEU a week less than in 2021 and 22 000 TEU lower than in 2020.
Note:
The 'Weekly Container Rates Update' blog analysis is derived directly from the Xeneta platform. In some instances, it may diverge from the public rates available on the XSI ®-C (Xeneta Shipping Index by Compass, xsi.xeneta.com. Both indices are based on the same Xeneta data set and data quality procedures; however, they differ in their aggregation methodologies.
Want to learn more?
Sign up today for our upcoming monthly State of the Market Webinar to stay on top of the latest market developments and learn how changing market conditions might affect your contract negotiations.
PS: Missed the LIVE session? Sign up to get the full webinar recording.