The spread in long-term rates for imports into the South American East Coast (SAEC) from several major regions has increased dramatically over the past year. Rates from North Europe, in particular, are taking off compared to those from the US East Coast (USEC) and Central American East Coast (CAEC).
The highest year-to-date increase in long-term rates on these three trades comes from CAEC, up by 145% since the start of the year, at USD 2 640 per FEU in early September. Smaller increases have been registered in rates from the US East Coast (+ 35% YTD) and North Europe (+4.9% YTD).
Read more below in Xeneta's weekly container rate update.
Long Term Freight Rate Trends
Looking also at how rates developed throughout 2021, rates from CAEC still have the highest percentage growth, up 370%, but in dollar terms, rates from North Europe have increased the most: up by USD 2 600 per FEU to USD 3 660 (+ 240%). In contrast, rates from the USEC have grown by less than USD 700 per FEU, standing at USD 1 480 per FEU on 7 September.
Due to a minor rate increase, the US East Coast has now become the cheapest of the three when exporting to the South America East Coast (SAEC) on long-term rates.
On 1 January 2021, rates out of the US East Coast were close to USD 250 cheaper than exports from the Central America East Coast (CAEC) and USD 250 more expensive than from North Europe. As of 7 September, it is USD 1 200 per FEU cheaper than Central America, despite the longer sailing distance, and USD 2 200 per FEU cheaper than exports from North Europe.
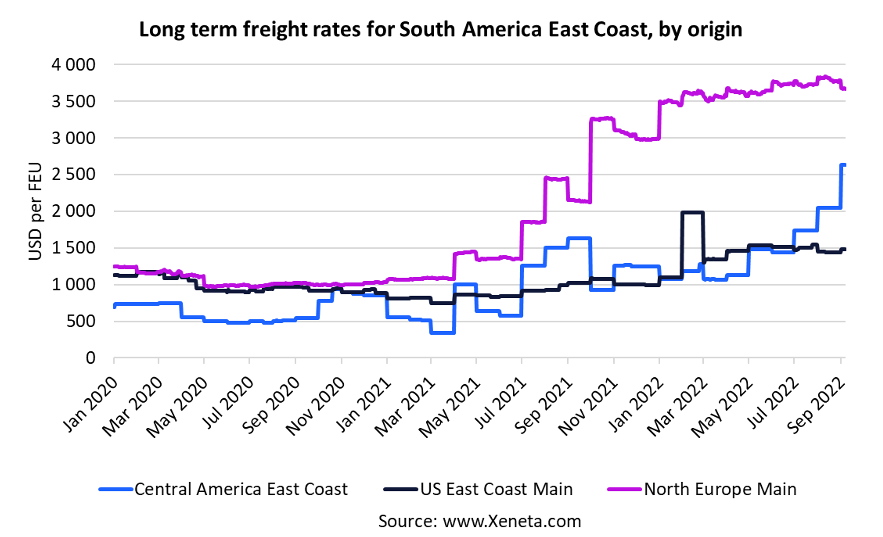
Historically, long-term freight rates from the US and Central American East Coast to South America East Coast have followed each other closely, with the route of Central America slightly less expensive than the other two. The USEC is now considerably cheaper, with rates from North Europe more than twice as high as the USEC, compared to an almost negligible pre-pandemic spread.
Volume-wise, North Europe is the largest exporter of the three to the South American East Coast, with around 315 000 TEU on this trade in the first half of 2022.
Central America is on the other end of the scale, which so far this year has exported 33 000 TEU to the SAEC. However, the latter is the only one of the three trades to see volumes grow, up 1.3% compared to 2021. Whereas volumes from North Europe are down by 10.7%, and those from the USEC are down 15.2%.
Note:
The 'Weekly Container Rates Update' blog analysis is derived directly from the Xeneta platform, and in some instances, it may diverge from the public rates available on the XSI ®-C (Xeneta Shipping Index by Compass, xsi.xeneta.com. Both indices are based on the same Xeneta data set and data quality procedures; however, they differ in their aggregation methodologies.
Want to learn more?
The container market is no walk in the park. You need to have the latest rate and supply data to be able to plan and execute your freight procurement strategy quickly.
Xeneta's real-time and on-demand data is here to help you answer, "Am I paying the right freight rate to get my cargo where it needs to be?"
Sign up for our weekly 15-minute live group demo below and see Xeneta for yourself.