Spot rates between the Far East and the South America East coast are rising again after falling close to 40% in the first four months of the year.
Since May, though, the turnaround has seen spot freight rates rise by USD 2 900 to USD 10 600 per FEU on 13 July. This is still down from the average spot rate at the start of this year when shippers paid an average of USD 12 400 per FEU.
Read more on Xeneta's latest weekly container rate update.
Short Term Rates Far East to South America East Coast
Compared to the start of the year, rates from South Korea to the South American East Coast have fallen the most out of the Far East Origins. Dropping by USD 2 200 per FEU, it is now below the average rate from the region to the South American East Coast.
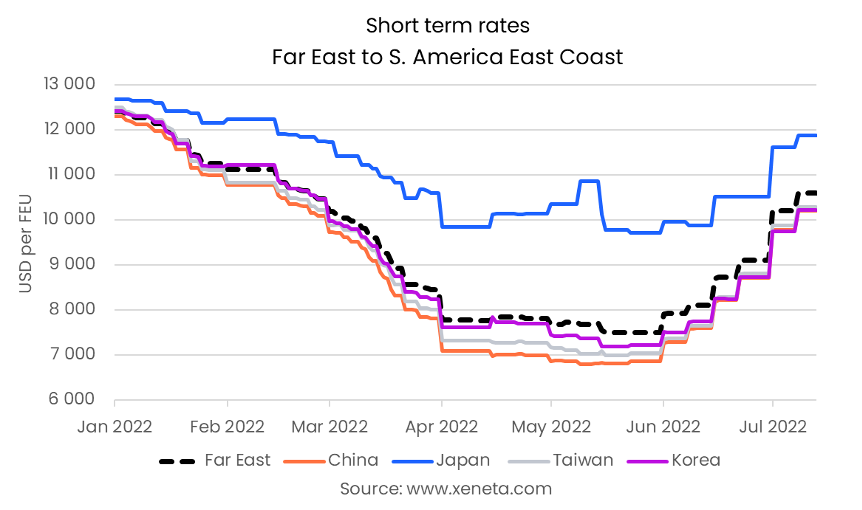 Only the spot rate out of Japan is higher than that out of the whole Far East, compared to the start of the year.
Japan was already the most expensive origin on this trade at the start of the year. After falling by just USD 800 per FEU through mid-July, it has become comparatively more expensive than its neighboring countries. On 13 July, shippers were paying USD 1 700 per FEU more to export from Japan to the South American East Coast than from China.
In contrast to the recent increases in the spot market, rates on the long term market have continued to fall into July.
The average rate of contracts with validity starting within the past three months stood at USD 7 750 per FEU on 13 July. So far this year, the long term market has followed the spot market with around a three-month delay. The fall in spot rates in January was reflected in April, with rates continuing to come down since then, so watch out for an increase in long term rates as these will reflect in the latest rise in spot rates.
Note:
The Weekly Container Rates blog analysis is derived directly from the Xeneta platform, and in some instances, it may diverge from the public rates available on the XSI ®-C (Xeneta Shipping Index by Compass, xsi.xeneta.com. Both indices are based on the same Xeneta data set and data quality procedures, however, they differ in their aggregation methodologies.
Want to learn more?
The container market is no walk in the park. You need to have the latest rate and supply data to be able to plan and execute your freight procurement strategy quickly.
Xeneta's real-time and on-demand data is here to help you answer, "Am I paying the right freight rate to get my cargo where it needs to be?"
Sign up for our weekly 15-minute live group demo below and see Xeneta for yourself.