In line with what we have seen on other major trades since the start of the year, spot rates from South East Asia to the US East Coast have fallen by 13.8% as of end May. Average rates on this trade have fallen from USD 13 650 per FEU to USD 11 770 while still being USD 5 000 per FEU, more expensive than 30 May 2021.
Read more on Xeneta's latest weekly container rate update.
Spot Rates From South East Asia To US East Coast
Digging further into the different origin countries, the biggest drop in spot rates since the start of the year came between Indonesia and the US East Coast. Here spot rates have fallen by 15.5%, though having started as the most expensive origin of the trade at the start of the year, it is still around USD 100 per FEU higher than the average for the whole trade.
Overtaking Indonesia as the most expensive origin is Thailand, where the average spot rate stands at USD 11 930 per FEU, USD 150 above the average rate for the whole region. This is a reversal from a year ago when Thailand was one of the origins offering the lowest spot rate on this trade.
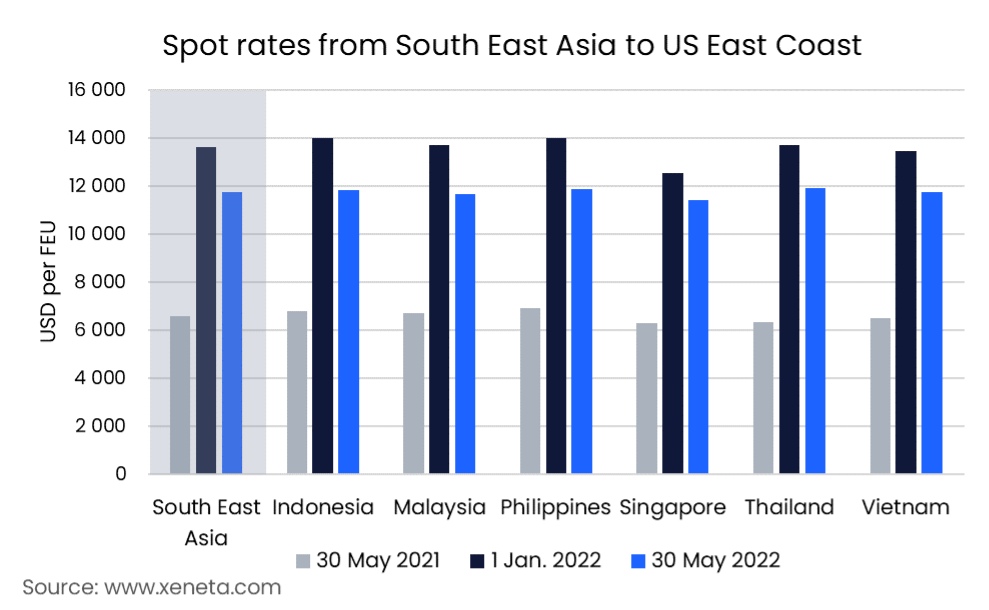 Singapore has been the cheapest country of origin for those looking to ship from Southeast Asia to the US East Coast all through 2022. However, it has also experienced the smallest drop in rates since the start of the year, falling by 9% from USD 12 550 on 1 January to USD 11 440 per FEU at end May. This has seen the discount offered by Singapore compared to the market average drop from USD 1 100 per FEU to USD 330.
Along with being the cheapest origin, Singapore also marks itself as the only transshipment hub, whereas others are direct-export origins.
This falling difference in rates between origins is happening across the board on South East Asia to US East Coast trade. At the start of the year, there was a USD 1 500 per FEU difference between the highest rate (from Indonesia) and the lowest rate (from Singapore).
As of end May, the difference had fallen to a third of that, USD 500 per FEU difference in rates from Thailand and Singapore, reducing shippers’ incentives to adjust their supply chains by using feeder ships to move their cargo to a cheaper port ahead of the main journey.
Despite falling since the start of the year, spot rates from South East Asia to the US East Coast remain above those on the long-term market, albeit only just at USD 500 per FEU.
As of end May, the average long-term contract within the past three months stands at USD 11 300 per FEU, up from USD 7 900 at the start of the year and USD 3750 at this time last year. However, it is down from a peak of USD 13 400 per FEU in April 2022, when the long-term rates were briefly higher than those on the spot market.
Note:
The Weekly Container Rates blog analysis is derived directly from the Xeneta platform, and in some instances, it may diverge from the public rates available on the XSI ®-C (Xeneta Shipping Index by Compass, xsi.xeneta.com. Both indices are based on the same Xeneta data set and data quality procedures, however, they differ in their aggregation methodologies.
Want to learn more?
With a possible global recession on the brink, shipping and supply chains will be put under further pressure.
Schedule a personalized demo of the Xeneta platform and learn how on-demand freight rate and market insight data will help you navigate through the current climate and identify potential savings in your freight spend.