
Since the start of the year, spot rates have continued to drop on the major trades out of the Far East. Spot rates from the Far East into the US are now below February 2020 level.
Of the four trades from the Far East to the US East and West Coast, North Europe and the Mediterranean, the biggest fall in spot rates has come to North Europe. Rates were down by 12.2% on 6 February from the start of the year, falling to USD 1860 per FEU.
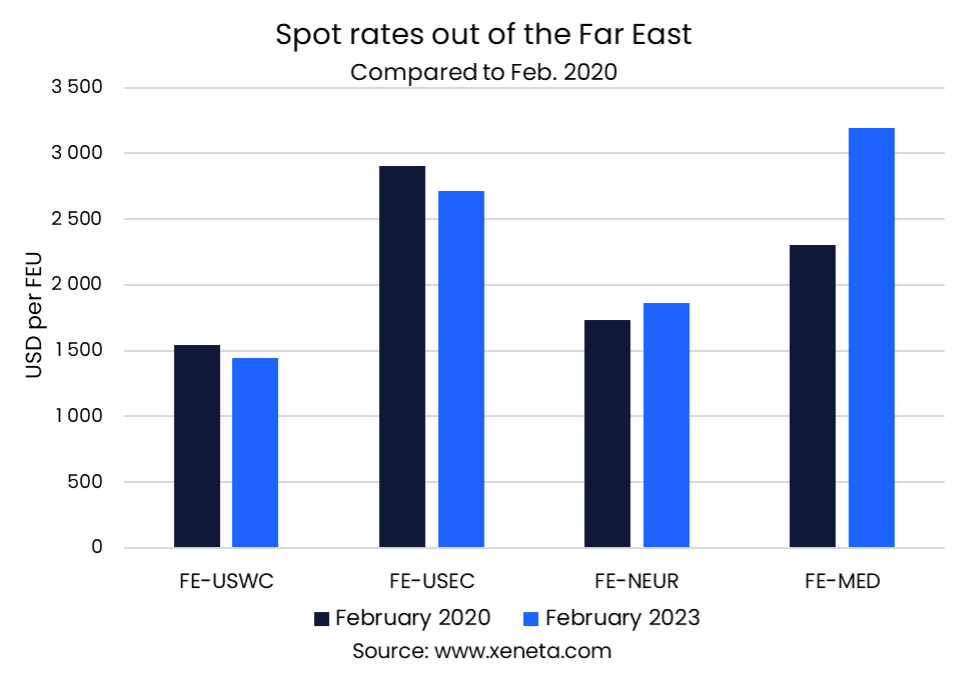
Despite this continued fall, spot rates from the Far East to North Europe are higher today than in February 2020, though only marginally. The spot rate on 6 February 2023 is around USD 150 per FEU, 7.5% higher than on 6 February 2020.
Spot rates from the Far East to the Mediterranean saw a much bigger increase compared to 2020. Despite rates falling by 7.2% from the start of this year, they are still up by 38.4% from February 2020. Spot rates on this trade currently average USD 3 190 per FEU, compared to USD 2 300 per FEU on 6 February 2020.
This means the spread in spot rates between North Europe and the Mediterranean when coming from the Far East has increased from USD 570 per FEU in February 2020 to USD 1 330 per FEU today.
In contrast, the spread in spot rates from the Far East to the two US coasts is now lower than it was in 2020, despite having risen in the past few years. Currently, the spot rate from the Far East to the US East Coast is USD 2 710 per FEU, USD 1 270 per FEU higher than those from the Far East to the US West Coast.
Another difference in the development between the US and Europe is that spot rates from the Far East to the US are now lower than they were in February 2020 - down by 6.2% to the US West Coast and 6.6% to the US East Coast.
In the absence of any positive outcome from the ongoing labor negotiations on the US West Coast, the resolution of congestion on the West Coast combined with falling demand means carriers are no longer able to charge a premium for services to the US East Coast. This would quickly change if labor disruptions affected activity on the West Coast, as was the case in 2015.
Note:
The 'Weekly Container Rates Update' blog analysis is derived directly from the Xeneta platform. In some instances, it may diverge from the public rates available on the XSI ®-C (Xeneta Shipping Index by Compass, xsi.xeneta.com. Both indices are based on the same Xeneta data set and data quality procedures; however, they differ in their aggregation methodologies.
Want to learn more?
Sign up today for our upcoming monthly State of the Market Webinar to stay on top of the latest market developments and learn how changing market conditions might affect your contract negotiations.
PS: Missed the LIVE session? Sign up to get the full webinar recording.