
Whether you or your business stakeholders are friendshoring, considering it, or have never even heard of it, one thing’s for sure – it has significant potential to influence the global rates picture. This week we have focused on comparing long-term contract rates between the Far East and the US West Coast (USWC) with those from South East Asia to the USWC.
With new commercial alliances front of mind, how are contracted rates developing? All eyes are, naturally enough, on Asia, as the West looks at partnerships in South East Asia as alternatives to its ongoing reliance on China.
Xeneta’s data paints an interesting picture, providing food for thought to shippers who may be considering shifting production facilities in the region.
At first glance, the main takeaway is the collapse in container rates from the highs of 2022 to 2023’s lows. But it’s also critical to notice the evolving differences between these two trades.
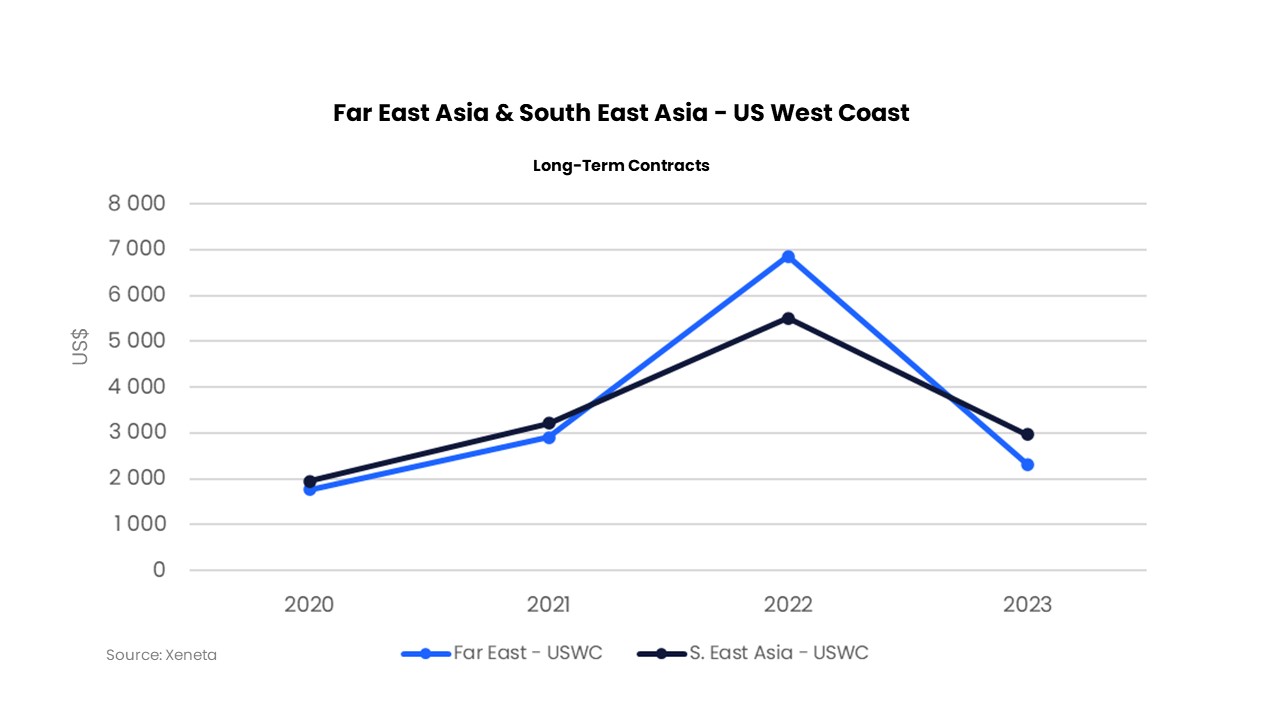
Rates from the Far East to the USWC are decreasing at a faster pace than those from South East Asia. Currently, the difference in price between the two trades to the USWC is USD 650, with South East Asia being the most expensive. However, if we look back to 2022 we see a very different picture, with the Far East – USWC trade commanding a strong premium over its counterpart. The difference between the trades at this point was USD 1350.
A significant difference in the pace of rate reduction fueled the reversal. Compared to a year ago, long-term container rates from the Far East to the US West Coast have fallen by 66%, while those from South East Asia are down by ‘just’ 46%.
How will this gap evolve and what does it mean for new commercial partnerships between the US and the Asian region? How will carriers respond and attempt to regulate the market? How will the Far East, which includes more than just China, outlook change, and what will the weight of sub-trades to the US reveal about the West’s commercial strategy?
We’ll keep an eye on the very latest data trends to help businesses understand the implications of the developing rates and trade landscapes. ‘Friend shore’ with us for more market intelligence soon.
Note:
The 'Weekly Container Rates Update' blog analysis is derived directly from the Xeneta platform. In some instances, it may diverge from the public rates available on the XSI ®-C (Xeneta Shipping Index by Compass, xsi.xeneta.com. Both indices are based on the same Xeneta data set and data quality procedures; however, they differ in their aggregation methodologies.
Want to learn more?
Are you looking for visibility into the volatile container shipping market? Find out how simple it is to get the insights and intelligence you need to make sure you, your team and your business quickly adapt to changing market conditions.
Know instantly how your freight rates compare against the market, justify your transportation costs, prepare for your tender period and report on your success with one powerful easy-to-use platform. Get a demo now!