In this week's blog, we dig deeper into three of the main global trade lanes to study capacity and how this has been changing over the last year. Carriers have been facing falling demand and so they have been managing capacity to avoid the effects of oversupply being fully reflected in rates.
Furthermore, as the market has fluctuated up and now down, there are shifting patterns on the top three global trades, including whether carriers are choosing to deploy or remove capacity from an alliance or non-alliance service. How this develops will be particularly interesting to watch ahead of the final termination of the 2M alliance in 2025.
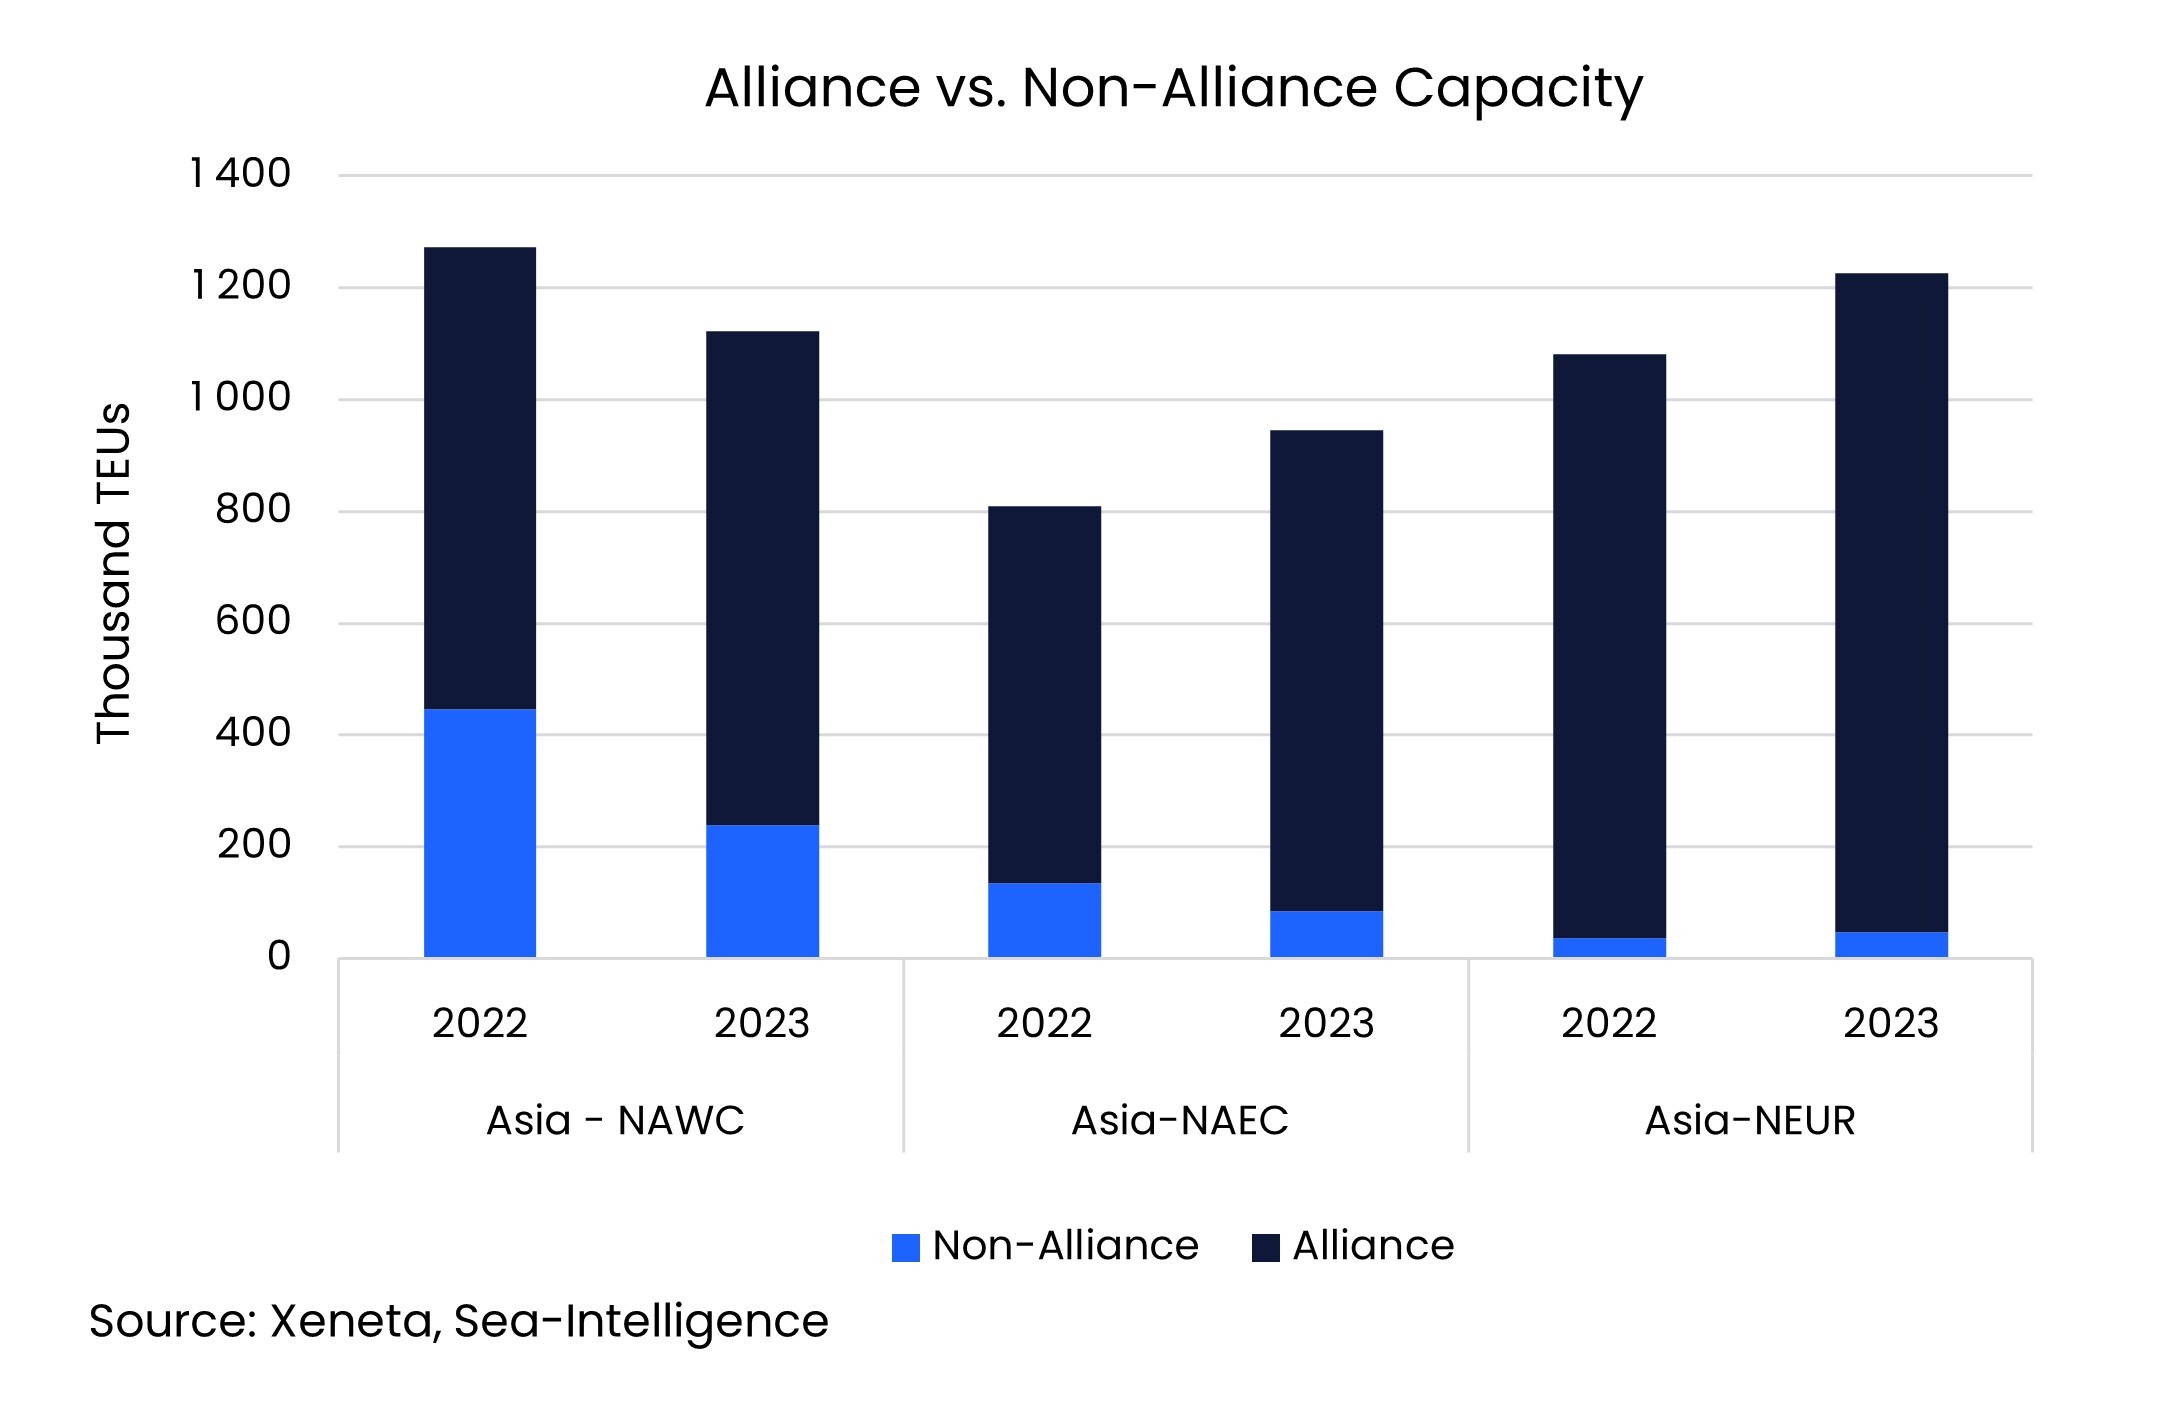
Out of the world's top three trades, the Far East to US West Coast stands out as having the highest share of non-alliance capacity in the four weeks leading up to 30 June. Just over a fifth of capacity deployed on this trade was done so outside of an alliance. In contrast, only 8.9% of capacity on the Far East to US East Coast was deployed on a non-alliance offering, while that share falls to just 3.9% on the Far East to North Europe.
Falling demand brings shift in direction
Despite having by far the highest share of non-alliance capacity of these three trades, the Far East to US West Coast has seen a fall in the share of non-alliance capacity. Overall, non-alliance capacity on this trade has fallen by 11.8% compared to the same four weeks in 2022. This has been driven by a 46.3% drop in the amount of non-alliance capacity being offered.
A year ago, carriers were still deploying extra ships on the Far East to US West Coast trade in order to meet higher demand and to counter the effects of congestion. These ships were primarily deployed outside of alliances but with demand now drastically down from last year these are the first services to be cut. In contrast, capacity offered within an alliance has increased by 6.7% year on year.
MSC has cut the most non-alliance capacity out of all the top carriers since last year, reducing its offering from almost 110 000 TEU outside of the 2M alliance to 36 500 TEU this year. This change has seen it lose its leading position as the major carrier with the most non-alliance capacity, with HMM now taking top spot in the four weeks ending 30 June this year.
There has also been a drop in the share of non-alliance capacity from the Far East to the US East Coast, falling by 7.7 percentage points from last year. In contrast to the development on the other transpacific trade to the US West Coast, total capacity into the US East Coast is up by 16.9% from last year. This shows how carriers have responded to shippers increasingly preferring the US East Coast over the West Coast when importing from the Far East.
From the Far East to North Europe, MSC dominates when it comes to offering capacity outside of an alliance, with its share standing at 52.2%. We will be keeping a close eye on MSC as it is now more than 1 million TEU bigger than Maersk and still pursuing its aggressive strategy of acquiring new tonnage ahead of life outside of the 2M alliance.
Note:
The 'Weekly Container Rates Update' blog analysis is derived directly from the Xeneta platform. In some instances, it may diverge from the public rates available on the XSI ®-C (Xeneta Shipping Index by Compass, xsi.xeneta.com. Both indices are based on the same Xeneta data set and data quality procedures; however, they differ in their aggregation methodologies.
Want to learn more?
Are you looking for visibility into the volatile container shipping market? Find out how simple it is to get the insights and intelligence you need to make sure you, your team and your business quickly adapt to changing market conditions.
Know instantly how your freight rates compare against the market, justify your transportation costs, prepare for your tender period and report on your success with one powerful easy-to-use platform. Get a demo now!