
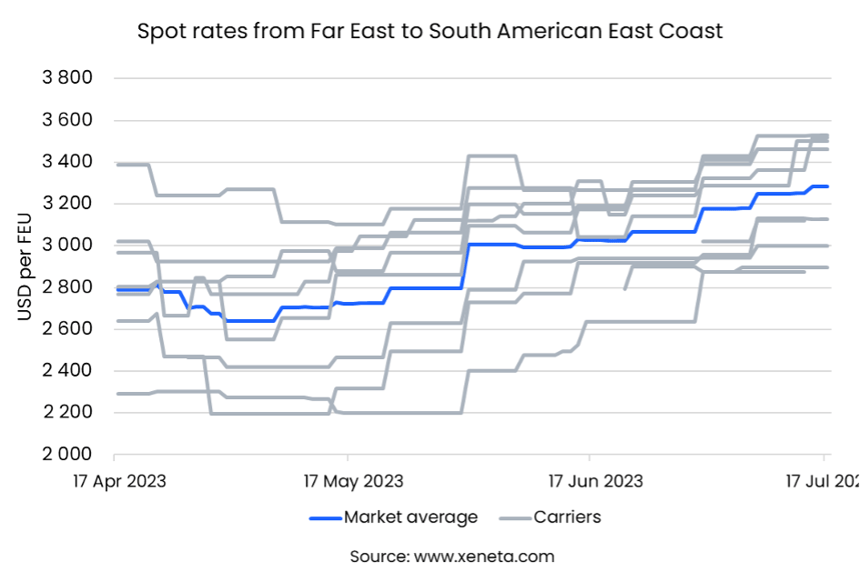
Spot rates on the Far East-East Coast South America (ECSA) trade corridor have defied the negative pull of the market that is keeping rates low on other major trade lanes. The average rate on the trade has risen by 17.7% over the past three months, up from USD 2,800 to USD 3,300 per FEU, its highest level since December last year.
Rates from all carriers on the trade have been climbing since mid-May, rising by USD 130 and then USD 700 per FEU in June. As of mid-July, carrier ONE had the highest average rate, with HMM offering the lowest.
Growing FE-ECSA volumes are in stark contrast to many other major trades, particularly falling volumes on the Transpacific corridors. Average filling factor data from Marine Benchmark clearly shows the extra upwards rate pressure; ships sailing FE-ECSA during Q2 were on average 92.5% loaded versus 83.2% on the FE-US East Coast (USEC) trade.
In addition to growing demand, draft restrictions in the Panama Canal due to low rainfall are also likely part of the equation driving up the filling factor. A further tightening was avoided following some precipitation, but Neo-panamax vessels are still being limited to a draft of 44.5 feet, down from the normal 50 feet. For heavily loaded ECSA-bound ships this presents a bigger challenge than those bound for the USEC, where restrictions have had little effect due to falling demand and a lower load factor.
The draft restrictions have also led to increased waiting times. Neo-panamax vessels particularly are facing lengthy delays, with the average waiting time for northbound ships having risen in mid-July to 11 to 12 days, up from 0 to 1 day in early June. If we weren’t currently experiencing both falling demand globally and ample vessel capacity, the restrictions would likely have had a much more significant effect on global spot rates. However, as is also the case with delays sparked by labor strikes in West Coast Canadian ports, their effect has been minimal.
Let’s see how long the FE-ECSA spot rate rise is maintained, or if it is just a short-term anomaly. Carriers at least will be happy with the situation right now.
Note:
The 'Weekly Container Rates Update' blog analysis is derived directly from the Xeneta platform. In some instances, it may diverge from the public rates available on the XSI ®-C (Xeneta Shipping Index by Compass, xsi.xeneta.com. Both indices are based on the same Xeneta data set and data quality procedures; however, they differ in their aggregation methodologies.
Want to learn more?
Are you looking for visibility into the volatile container shipping market? Find out how simple it is to get the insights and intelligence you need to make sure you, your team and your business quickly adapt to changing market conditions.
Know instantly how your freight rates compare against the market, justify your transportation costs, prepare for your tender period and report on your success with one powerful easy-to-use platform. Get a demo now!