
Spot rates on the trans-Pacific trade route from China to the US West Coast (USWC) have been a source of concern, particularly for the retail industry. Despite two unsuccessful attempts at General Rate Increases (GRIs) in recent months, carriers are once again pushing for higher rates. In this update, we delve into the dynamics of these spot rates and their implications for retailers.
GRIs fall flat
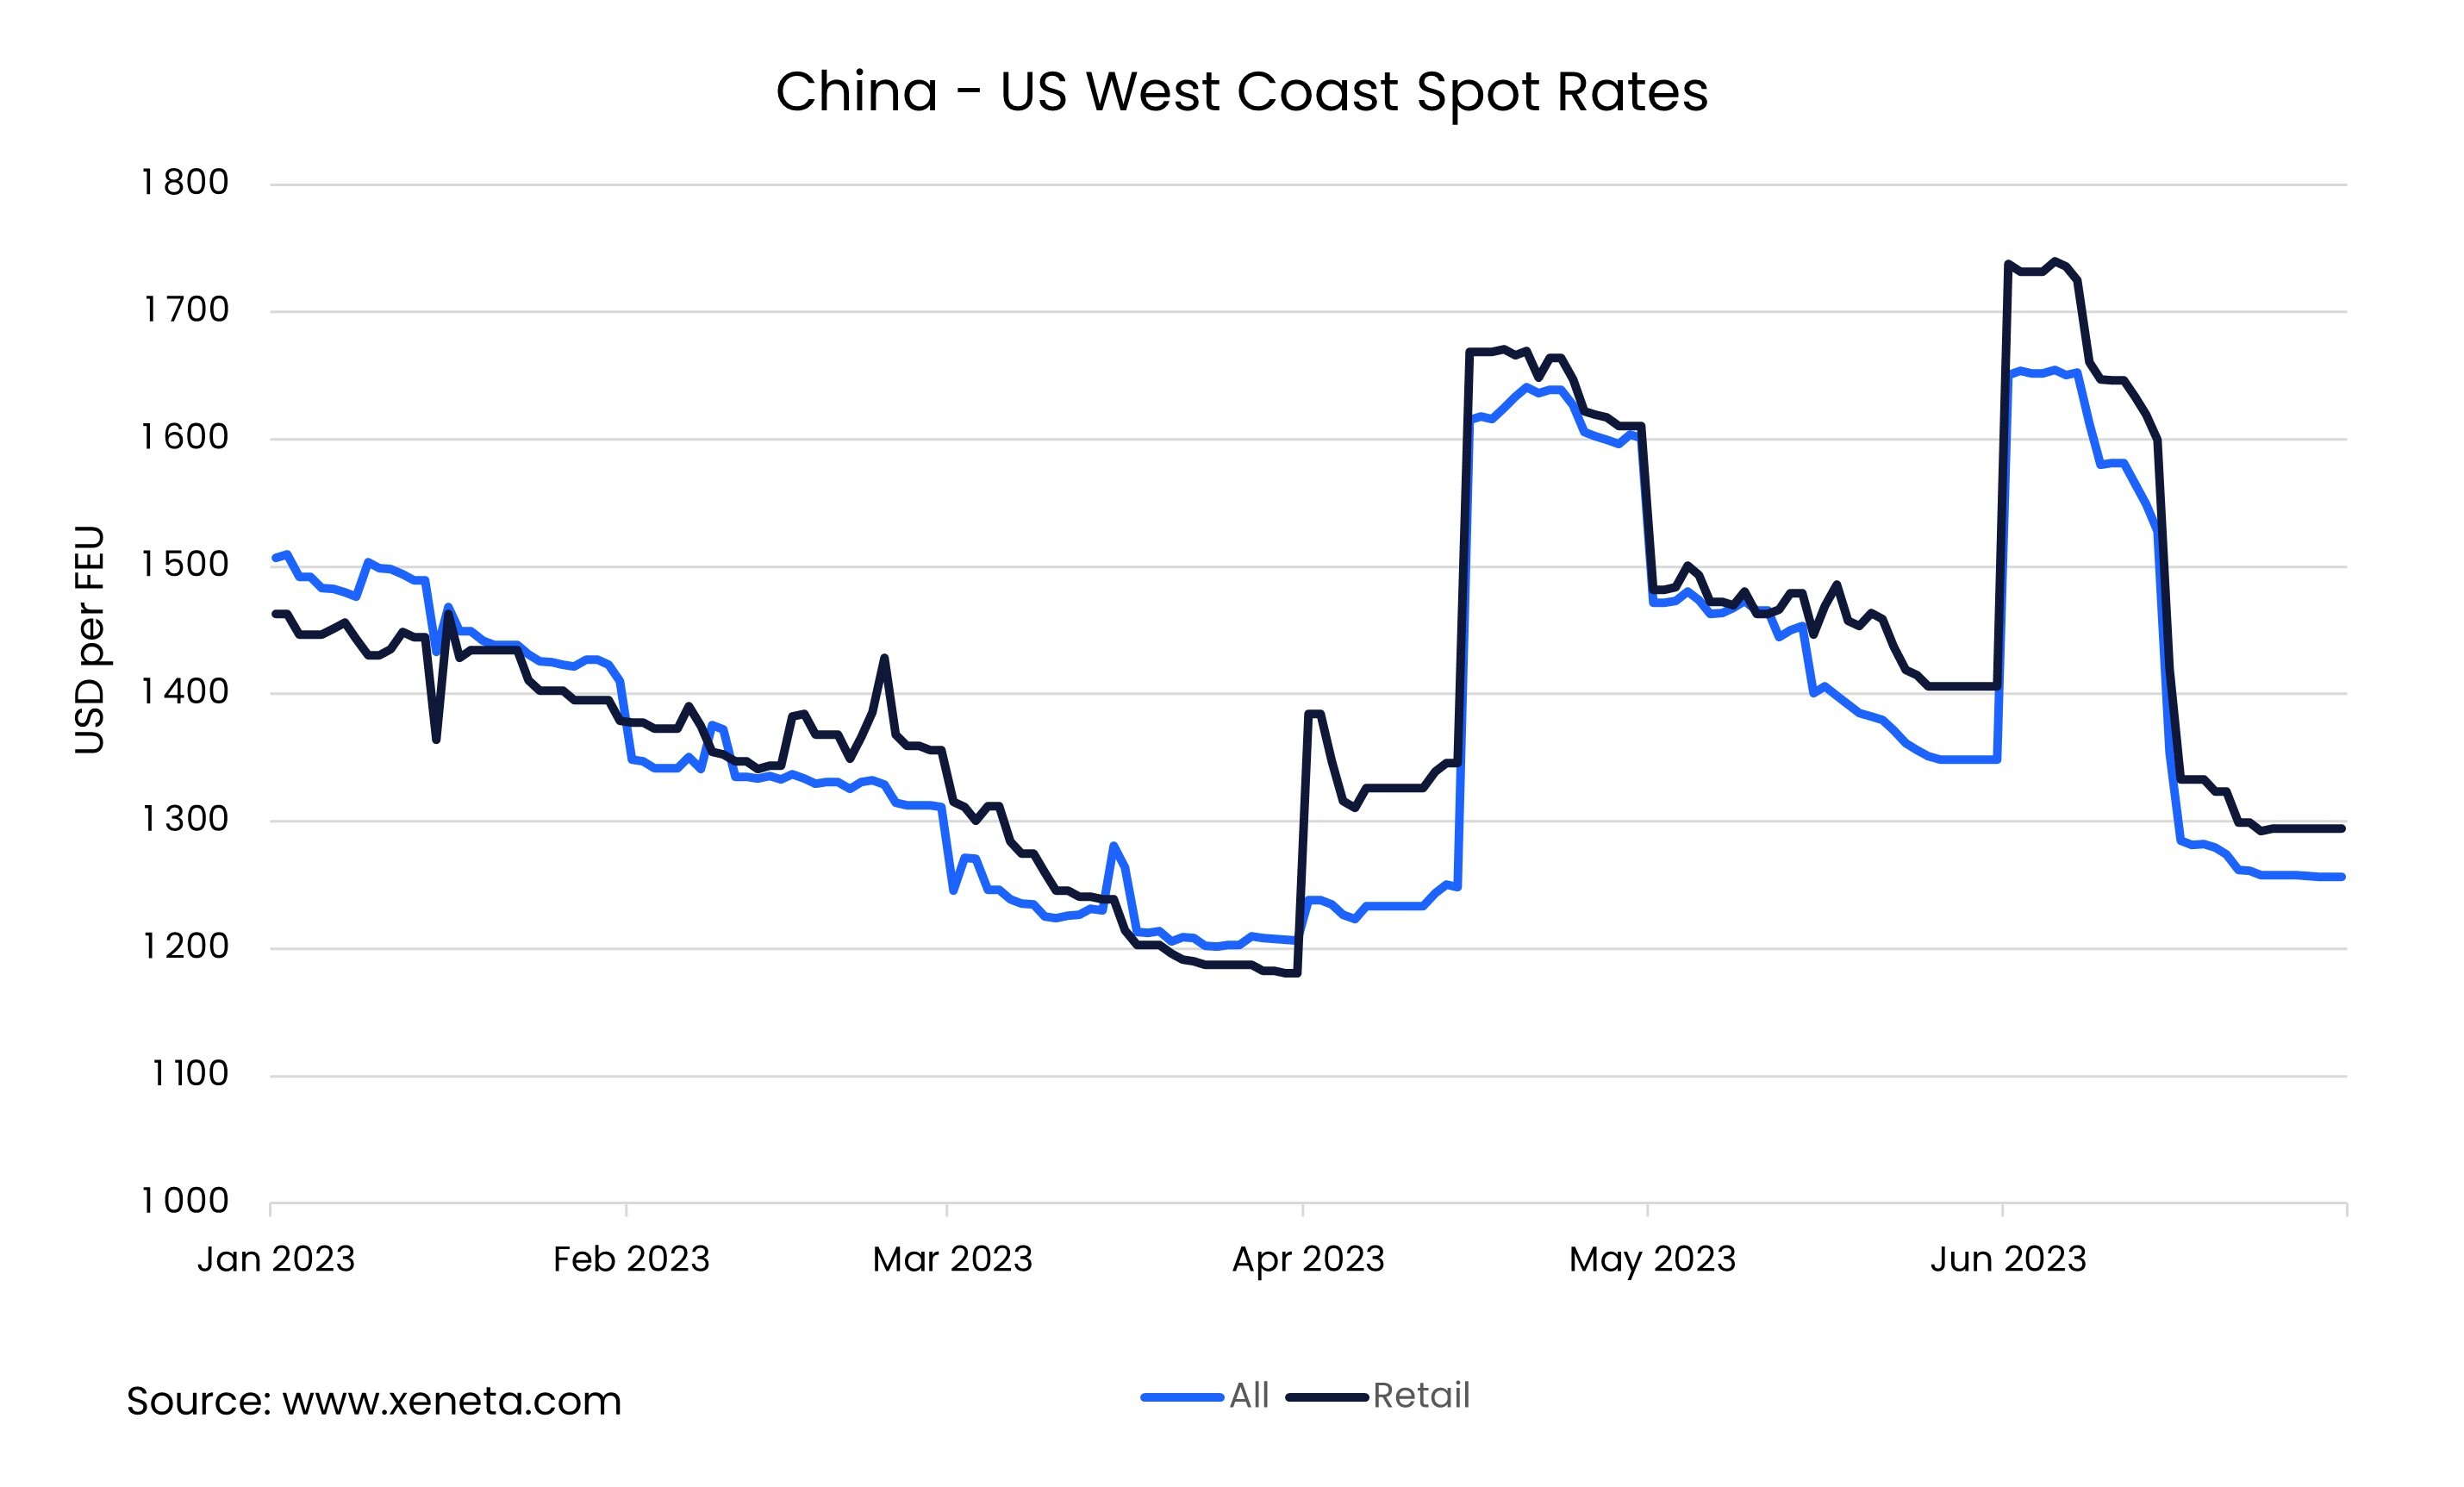
Neither of the previous rounds were particularly successful, with average spot rates falling shortly after the GRI in both cases. In fact, after an average increase of USD 330 per FEU at the start of June, rates crashed so much during June that the average fell to USD 110 below the level they had been at before the increase.
Despite this slide, rates between China and USWC are slightly higher than they were at the start of the second quarter.
The beginning of July has seen carriers again pushing for a GRI, although less forcefully than on the two past occasions. Market conditions have not improved since then and there is very little to suggest that this GRI will be more fruitful.
Big rate differential for retail
For the retail sector, the impact of these spot rates has been substantial. On April 1st, spot rates for the US retail industry surged, while the overall market average remained relatively stable. The gap between retail industry rates and the market average increased 5x, growing from USD 25 per FEU in late March to USD 145 in early April.
Contrary to the first quarter, the retail sector has consistently paid higher rates than the Transpacific market average. By the end of June, retail spot rates had reached USD 1 300 per FEU, standing USD 40 higher than the market average.
Impact of inventories and inflation
The weak spot rates reflect a decrease of 26.9% in container volumes on the Transpacific in the first four months of the year. However, despite import volumes have fallen dramatically, US retail sales have continued to grow modestly, up by 2.2% in the first five months of the year.
The gap between imports and retail sales can be explained by several factors. One is the high level of backlog inventory, meaning that retailers can still generate sales without necessitating new imports. Another is the impact of inflation, which although falling remains higher in retail sales (i.e., prices), equating to a fall in overall retail sales volumes on a year-on-year basis.
It will be interesting to see how US retail sales develop over the next months into the autumn and towards the Christmas season, and if decreasing inventories lead to renewed imports and stronger spot rates in their wake.
Retailers and wholesalers are using different strategies to deal with high inventories. Some are offering heavy discounts to lower stock levels. This is driving up the expectations for a discount heavy holiday season and poor peak season for shipping. Others have chosen to go the other way, keeping the now out of season goods they have in stock for next year, preferring to order new goods for this holiday season. This is however not enough to make up for the lower demand from the majority choosing to deplete inventories.
What is clear is that for the majority of retailers and wholesalers these stock levels are higher than what they would like. This indicates that once these have been drawn down we will once again see a stronger link between retail sales and container imports.
Note:
The 'Weekly Container Rates Update' blog analysis is derived directly from the Xeneta platform. In some instances, it may diverge from the public rates available on the XSI ®-C (Xeneta Shipping Index by Compass, xsi.xeneta.com. Both indices are based on the same Xeneta data set and data quality procedures; however, they differ in their aggregation methodologies.
Want to learn more?
Are you looking for visibility into the volatile container shipping market? Find out how simple it is to get the insights and intelligence you need to make sure you, your team and your business quickly adapt to changing market conditions.
Know instantly how your freight rates compare against the market, justify your transportation costs, prepare for your tender period and report on your success with one powerful easy-to-use platform. Get a demo now!