Since Brexit, the United Kingdom (UK) has been on the lookout for new trading partnerships as part of its new approach to foreign policy. Amongst other initiatives, London has prioritized a free trade agreement (FTA) with India, but the parties are struggling to come to agreement on several key issues.
An FTA with the UK could bolster India’s ambition to become the world’s third-largest economy by 2050 while also enhancing bilateral cooperation. However, there are no potential winners without likely losers, as a deal with the UK might negatively affect its neighbors, notably Bangladesh, as they compete for the same UK market in sectors such as retail fashion and apparel, pharmaceuticals and organic chemicals.
Unfolding story…
Here we analyze container spot rates from India and Bangladesh to the UK, and what developments might show up in the coming months as FTA talks continue between New Delhi and Westminster.
India / Bangladesh spread evaporates
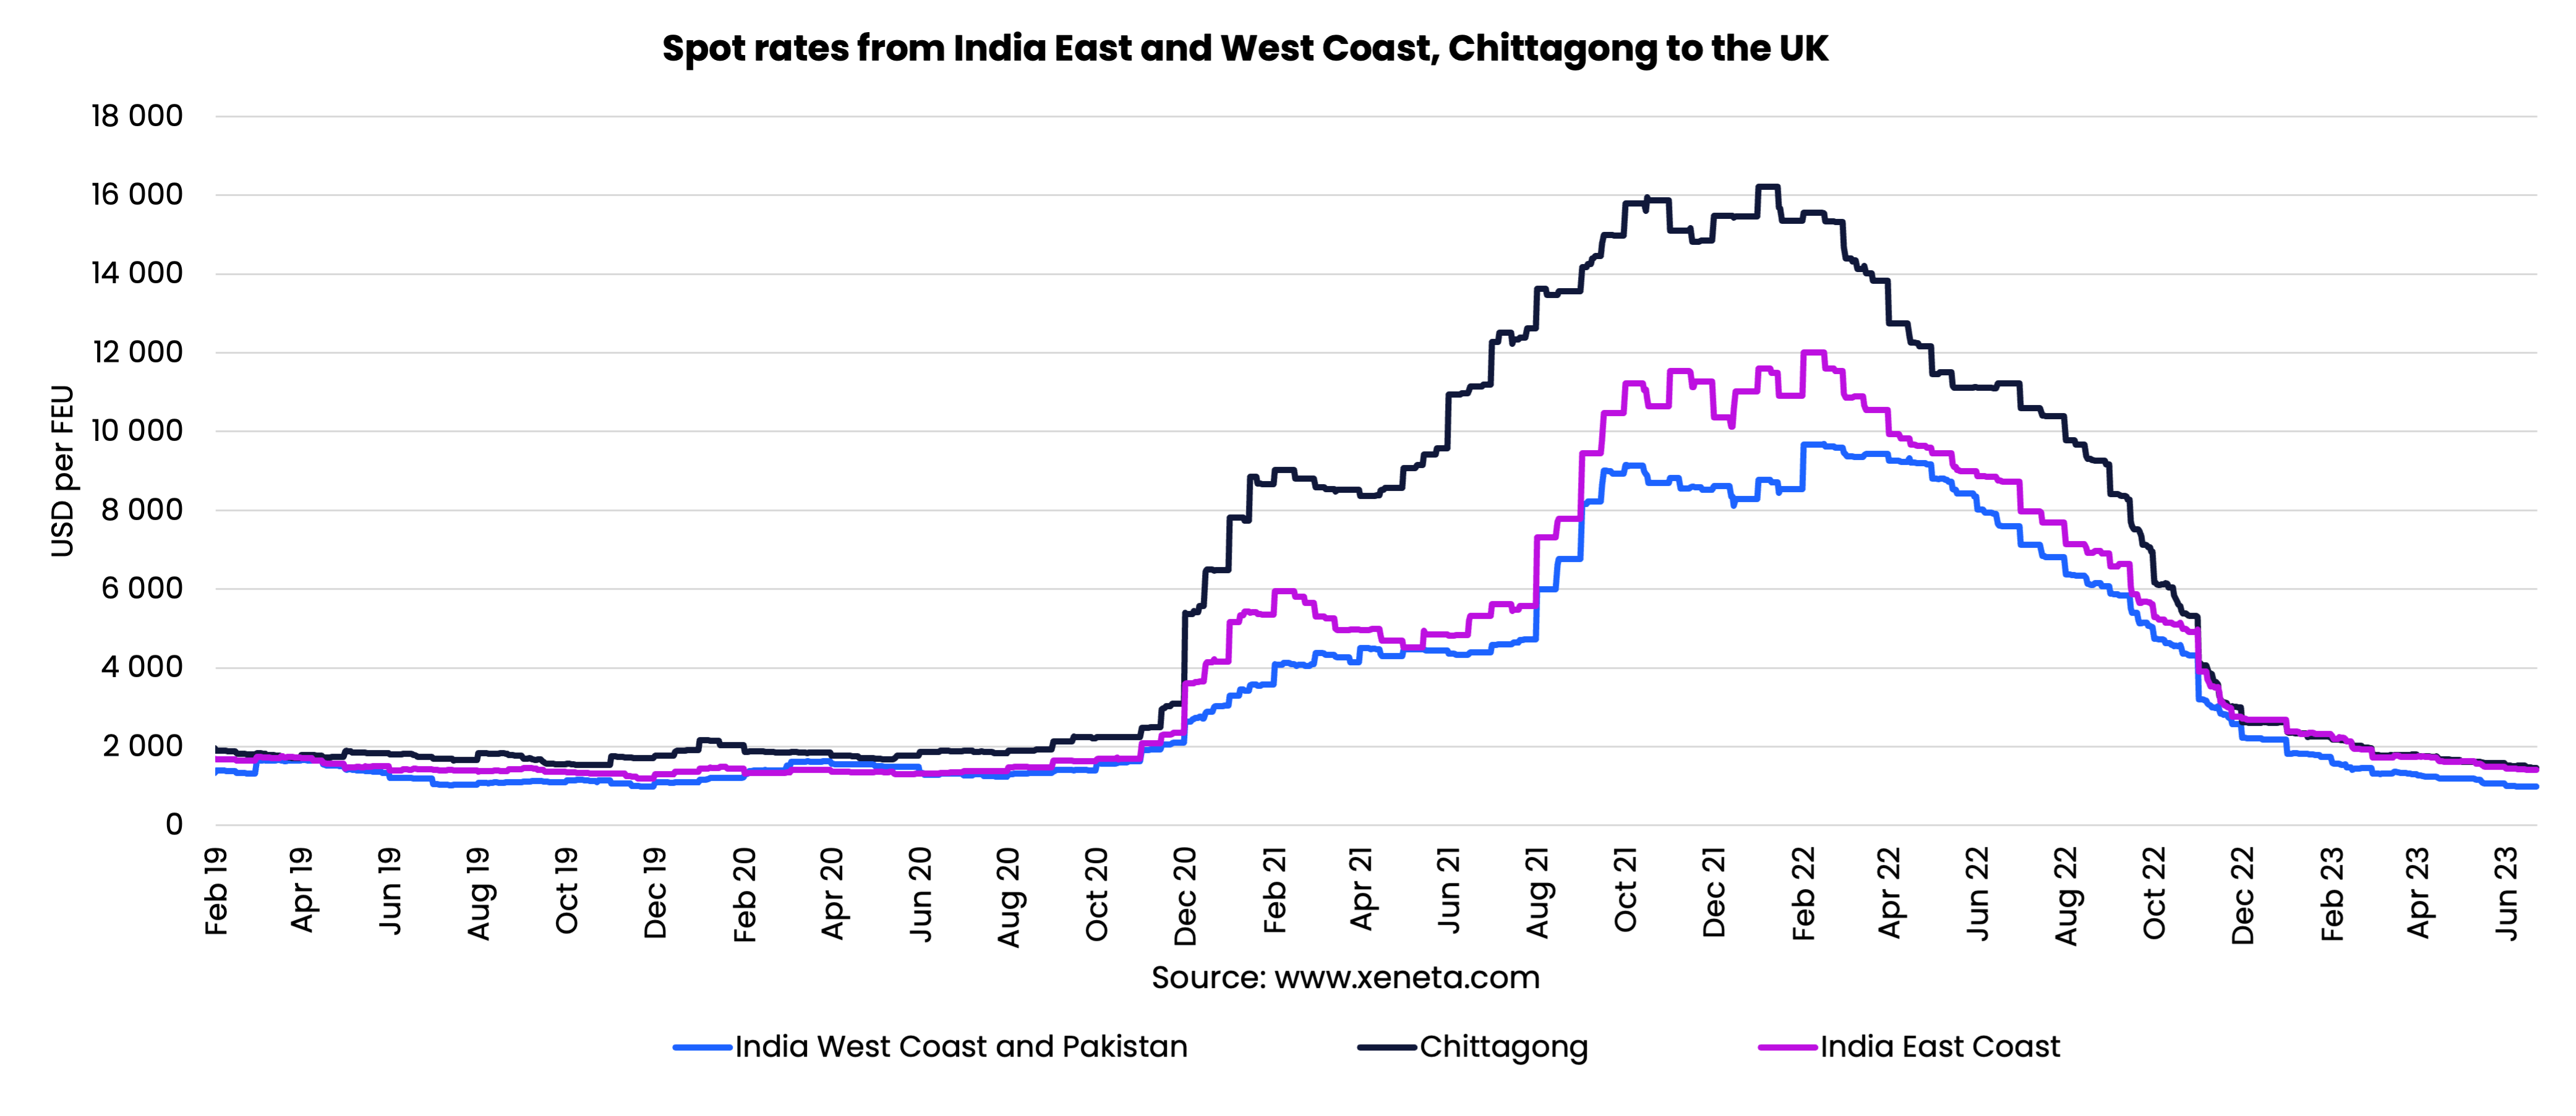
Since the start of 2023, there has been ongoing decline in spot rates from India’s West and East Coasts, and from Chittagong in Bangladesh to the UK. It is also interesting to see that the big spread between Chittagong-UK and both Indian coasts to the UK during 2021 and 2022 has all but evaporated.
That spread really opened up from December 2020, when both Bangladesh and India experienced sharply rising spot rates to the UK. Rates jumped by 25% from India West Coast (and Pakistan), 53% out of the East Coast and a spectacular 75% out of Chittagong.
By January 2021, Chittagong export rates had jumped even higher, reaching USD 7,815 per FEU and widening the spread with India East Coast to USD 4,514 per FEU (+31%) and West Coast to USD 2,649 per FEU (+14%).
By mid-July 2021, the spread between Chittagong and India West Coast peaked at USD 7,900 per FEU, but the spot rate rise was still only half done. Rates from both origins climbed by a further USD 4,000 per FEU before absolute peaks were reached in the first half of January 2022 (USD 16,200 per FEU) and February 2022 (USD 9,700 per FEU).
India East Coast takes the cake
Another interesting fact regarding exports from India to the UK during COVID is the divergence between its two coasts. The East Coast was higher throughout that period, with the spread rising to USD 3,000 per FEU in November 2021. That narrowed significantly in Q2-2022, but never fully settled to pre-pandemic levels of around USD 135 FEU. It currently stands at USD 420 per FEU.
This week (end-June 2023), the spot rate differential between Chittagong and India West Coast is USD 474 per FEU – which has not been seen since 2019. Chittagong still has the highest rate, with the differential displaying volatility since the start of the year (ranging from USD 400 to USD 600 per FEU).
Ramifications for retail?
Post-pandemic, India East Coast has emerged on par with Chittagong, no longer with the West Coast, which geographically makes much more sense and fits well with carriers’ pricing strategies.
It will be important for UK shippers with supply chains from India and Bangladesh to keep an eye on trends in these lanes as trade negotiations could very well shift the status quo. An FTA between the UK and India, the world’s largest democracy, could very well redefine rate competition to the UK market. How will this impact the retail industry in which both India and Bangladesh are important players?
Keep an eye out for future blogs as we dive more into key trade corridors and industry-specific topics!
Note:
The 'Weekly Container Rates Update' blog analysis is derived directly from the Xeneta platform. In some instances, it may diverge from the public rates available on the XSI ®-C (Xeneta Shipping Index by Compass, xsi.xeneta.com. Both indices are based on the same Xeneta data set and data quality procedures; however, they differ in their aggregation methodologies.
Want to learn more?
Are you looking for visibility into the volatile container shipping market? Find out how simple it is to get the insights and intelligence you need to make sure you, your team and your business quickly adapt to changing market conditions.
Know instantly how your freight rates compare against the market, justify your transportation costs, prepare for your tender period and report on your success with one powerful easy-to-use platform. Get a demo now!