
If you want containerized goods shipped into Europe, you can do it via Mediterranean or North European ports and terminals. If you take the relatively less-beaten track via the East Mediterranean, Black Sea or West Mediterranean right now (mid-June), you pay a premium of USD 1 150 per FEU compared to a North European option. This is a sign of two closely related corridors having very different run-ups to the traditional peak season in Q3.
So, what’s going on?
Is volatility the new normal?
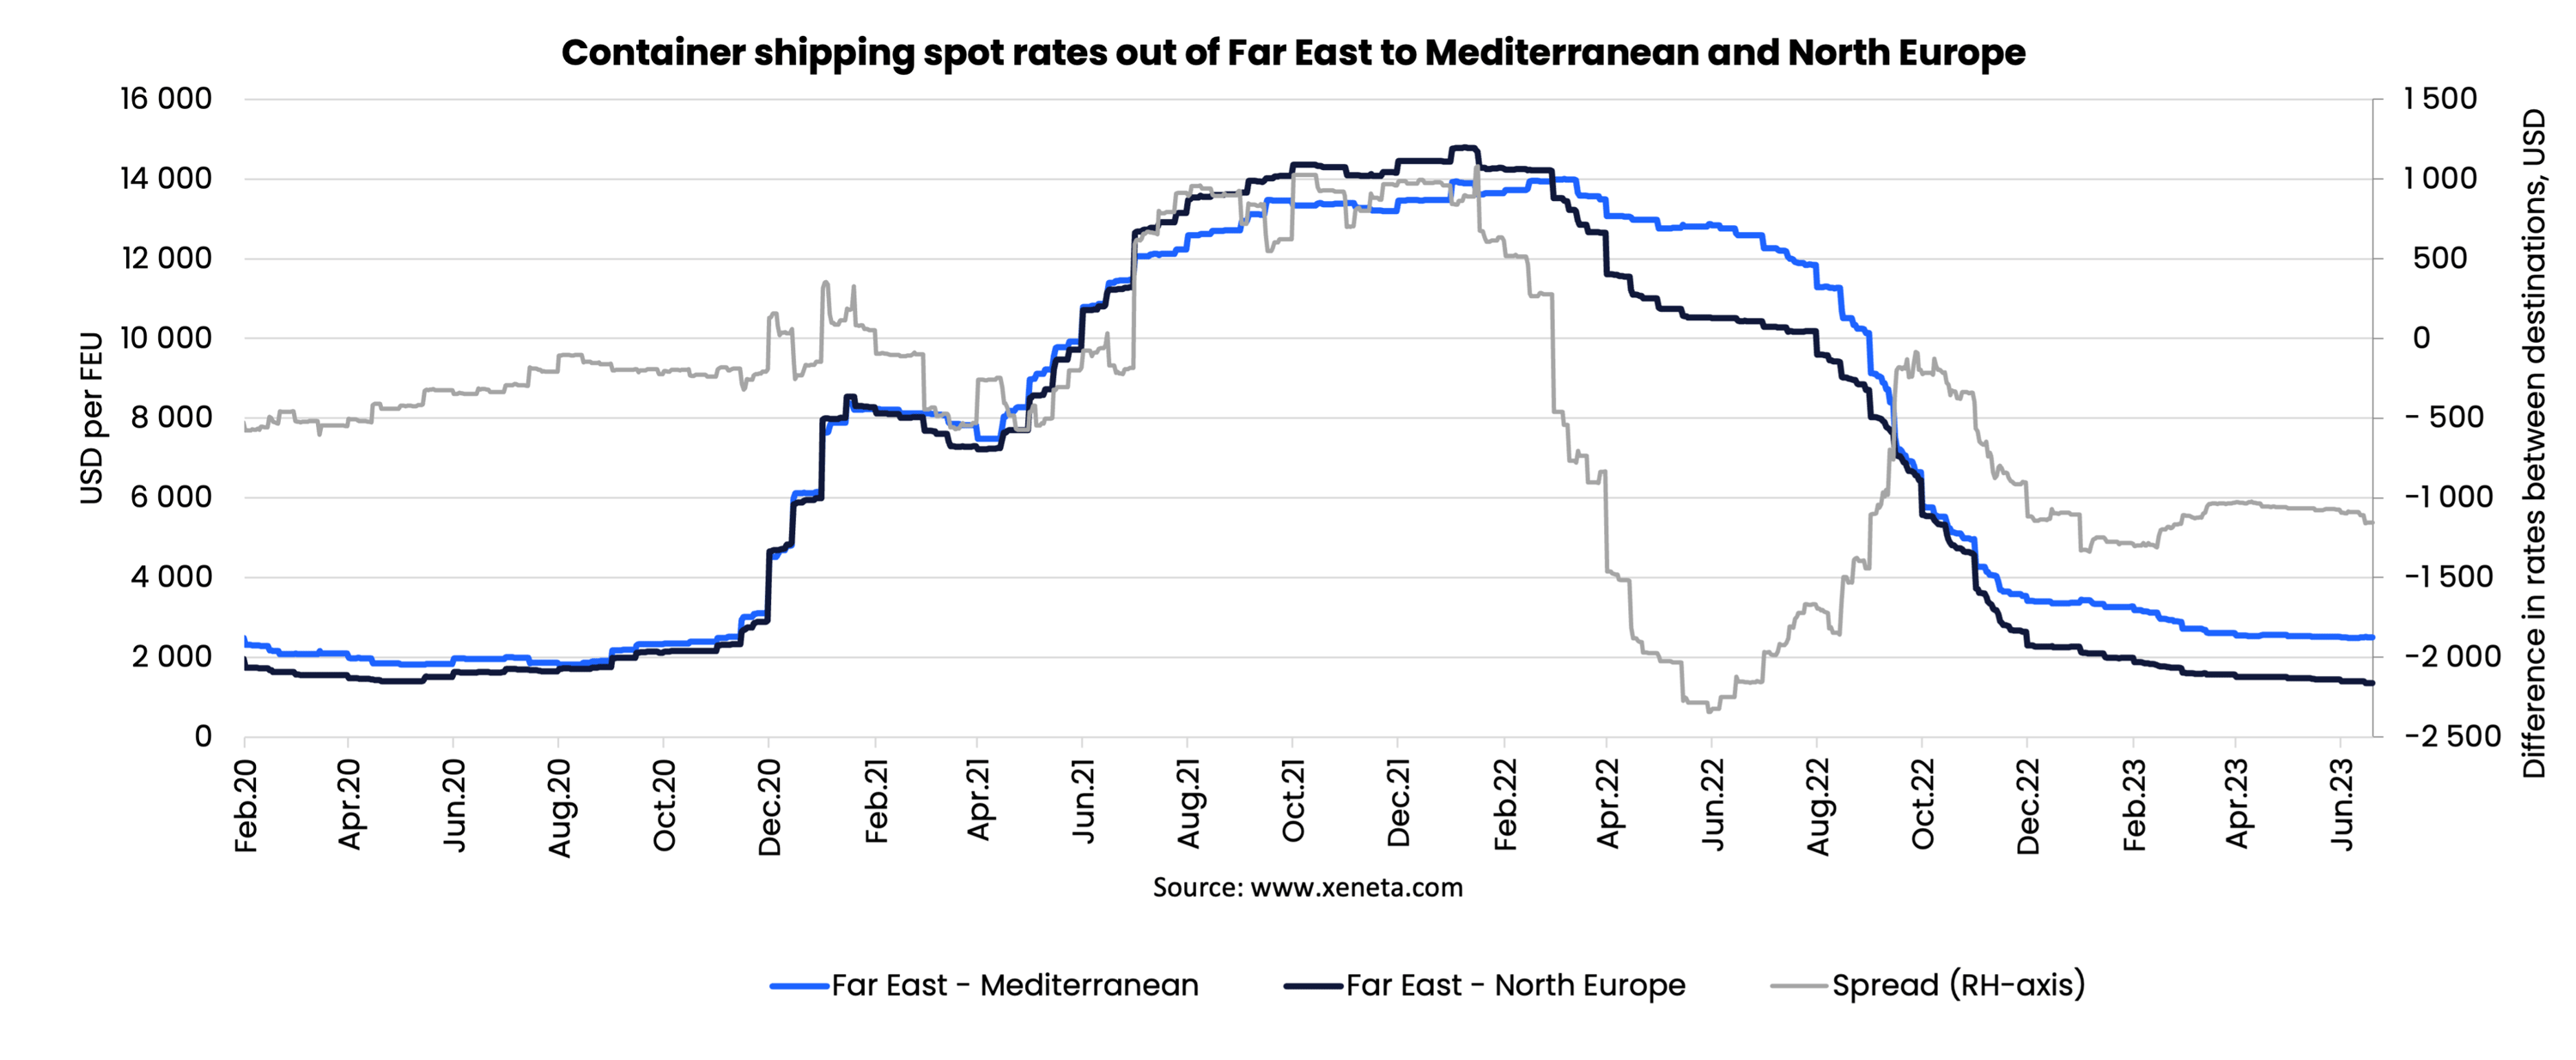
Xeneta data shows that the traditionally stable relationship between spot market freight rates for Asian exports destined for the Mediterranean region and North European ports has been fluctuating, and doing so in dramatic fashion, for more than two years now.
Between January 2015 and June 2021, the average premium paid for shipping containers into the Mediterranean was less that USD 100 per FEU. However, the second wave of covid-related disruptions in Q2 2021 introduced a new degree of volatility, fueling a growing spread in the spot rates. This spread peaked in Q4 2021, when Far East to North Europe spot rates hit USD 14 300 per FEU, almost USD 1 000 more than Mediterranean-bound containers.
Less than six months later, in May 2022, another extreme was reached, as spot rates for North Europe bound containers fell faster than those for Mediterranean bound units. At that time, it was USD 2 300 per FEU more expensive to ship via Mediterranean ports than through the main ports of North Europe.
Further market volatility then brought the spread back towards zero, before a new divide appeared – one that appears to be more enduring.
On demand – fueling the spread
When combining Xeneta’s freight rate data with container movements from Container Trades Statistics (CTS), we can see that demand have been moving in opposite directions for the regions of North Europe and the Mediterranean, especially when considering the ‘East Mediterranean and Black Sea’ (East Med).
Imports for the first four months of this year, January to April 2023, fell by 8.0% into North Europe (-280k TEU), while growing a significant 21.9% into the East Med (+195k TEU). Demand into the West Med (Italy, France, Spain etc.) grew by 2.3% in the same period.
Higher demand often translates into higher spot market prices. This was the case in 2021, when North European imports from the Far East grew by 10.1%, while East Med imports from the same origin fell by 1.5%. This created a premium of USD 862 per FEU into North Europe. In the second half of 2021, the spread grew to sit between USD 550 and USD 1025 per FEU – a range that, up to that point, was unheard of.
Long-term implications
Fast growing demand tends to impact negatively upon carrier schedule reliability, as demonstrated by the fact that the Far East to Mediterranean corridor now has a much lower reliability at 53.5%, with the Far East to North Europe corridor benefitting from a slightly more comfortable 62.3%. Although both sets of figures are disappointing, they are a huge improvement on the appalling levels experienced in both 2021 and 2022. (Source: Sea-intelligence).
Additionally, blank sailings on the Far East to Mediterranean route are almost non-existent, whereas the Far East to North Europe trade lane is seeing between 5 and 13% of capacity blanked.
The change in demand is also clear in Xeneta’s data for the long-term contract market.
From July 2021 through to the start of 2023, long-term contracts into North Europe were more expensive than those for Mediterranean terminals. However, for the past six months, long-term contract rates into the Mediterranean have assumed pole position, indicating that a ‘normalization’ of these trades is still ongoing. We definitely haven’t seen the last word in this tale of dueling corridors and fluctuating rates.
The spread between the two is gradually growing, with a current divide of USD 625 per FEU. North Europe is the cheaper option, currently commanding USD 1 600 per FEU. Looking back to the pre-pandemic days, the spread in long-term contracted rates was minimal.
Charting the way ahead
The Mediterranean market is clearly the strongest at the moment; an observation backed up by the fact that spot rates are higher than contract rates. The reverse is true for North Europe, where, despite a fall of USD 600 per FEU in early April, contracted rates are still slightly above spot market prices. This indicates a weak market… and one that may not recover anytime soon.
Be on the lookout for exports out of Japan, Taiwan, and South Korea, as these nations are growing volumes into the Mediterranean in 2023, whereas exports out of Southeast Asia are falling, despite China’s post-covid recovery during the spring. This is somewhat of a role reversal, as Southeast Asia exports were much stronger than those from Northern Asia during 2022.
When we consider that the strong rise in demand into the Mediterranean in 2023 has merely prevented the region’s spot rates from falling faster, we should not expect a massive surge in freight rates going into the traditional peak season. Plenty of factors point towards a European market where carriers will push for the implementation of General Rate Increases. However, that is something that is likely to bring only short-lived spot rate gains.
Stay tuned for further developments on these two similar, yet distinctly different, key trade corridors.
Note:
The 'Weekly Container Rates Update' blog analysis is derived directly from the Xeneta platform. In some instances, it may diverge from the public rates available on the XSI ®-C (Xeneta Shipping Index by Compass, xsi.xeneta.com. Both indices are based on the same Xeneta data set and data quality procedures; however, they differ in their aggregation methodologies.
Want to learn more?
Are you looking for visibility into the volatile container shipping market? Find out how simple it is to get the insights and intelligence you need to make sure you, your team and your business quickly adapt to changing market conditions.
Know instantly how your freight rates compare against the market, justify your transportation costs, prepare for your tender period and report on your success with one powerful easy-to-use platform. Get a demo now!