This week’s blog sees us take a virtual trip back to Latin America to analyze market trends in long- and short-term contracts on the Far East – Brazil corridor, and specifically to Santos.
According to the 2022 Lloyd’s List top 100, Santos ranks as the world’s 41st largest port. With the South America East Coast receiving 38% of containerized goods entering South and Central America from the Far East (source: CTS), equivalent to almost 1.7 million TEUs in 2022, the importance of the Brazilian port as a key regional hub is clear.
The value of intelligence
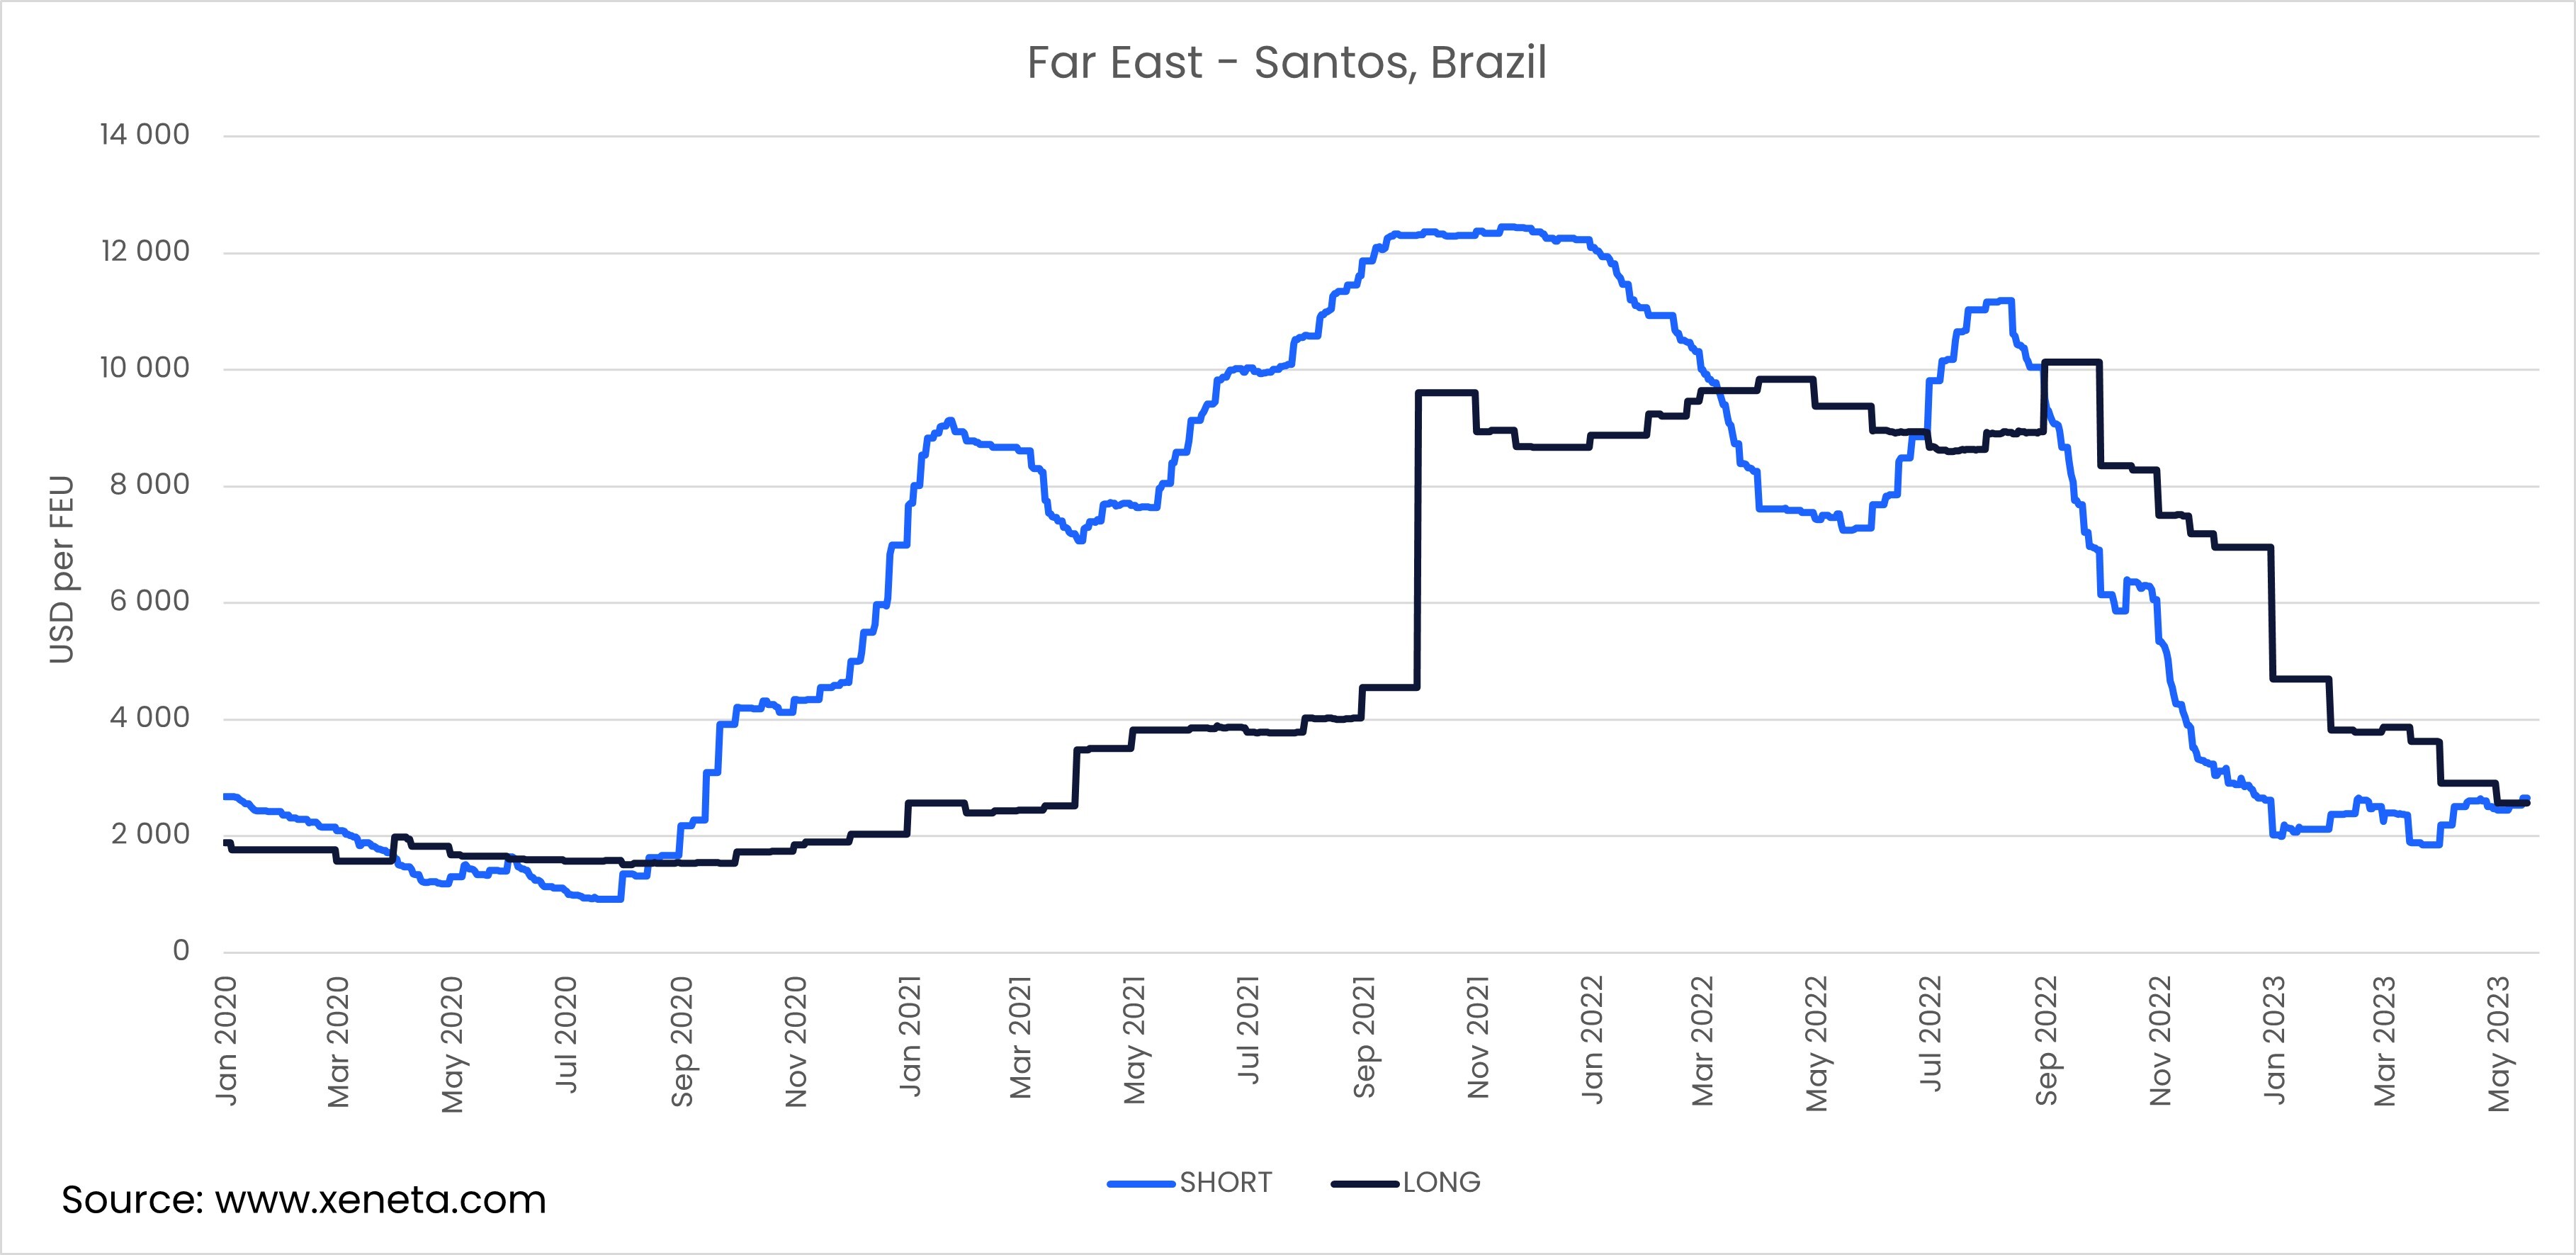
Volatility has been an issue on this trade long before it gripped the wider global ocean freight market during the COVID-19 years (2020-2022). However, unlike the pandemic period, these earlier fluctuations were on a smaller scale, ranging from USD 1 100 to USD 3 500 per FEU.
When COVID-19 hit, prices initially dropped and then surged upwards in the second half of 2020. This created real challenges for shippers, who had to decide whether to stick to long-term contracts or turn to spot rates as they sought to adapt to this new level of unpredictability.
The need for such a limber logistics approach highlighted the value of accessing intelligent market data for optimal decision making - a key learning that continues to ring true as the market evolves to find the next ‘new normal’. Data is still the foundation of solid procurement processes as shippers work to balance spot and contract agreements in today’s service contract negotiations.
Rewriting the record books
Looking at the pandemic volatility in detail, the Far East – Brazil trade experienced an array of eye-catching developments. Focusing on short-term contracts, freight rates soared to an interim peak of USD 7 678 per FEU in January 2021, dipping slightly before surging to an all-time-high of USD 12 454 per FEU in mid-November 2021. Rates then began a bumpy decline that was arrested in May 2022, as a third peak emerged, seeing prices rally to reach USD 11 183 per FEU in early August.
This short-term development was fueled by a growth in import demand, far beyond normal patterns, during June-August. Volumes reached a then all-time-high for the Far East to the East Coast of South America corridor in July 2022 (source: Container Trades Statistics).
Slowly, slowly… then up, up and away
Switching to the long-term market, the trend developed differently, with rates building up steadily from November 2020, when prices averaged below USD 2 000 per FEU. October 2021 then saw rates rocket skywards, with an unprecedented 139% month-on-month climb. This shortened the spread between long- and short-term contracts to USD 2 719 per FEU.
As spot rates fell between February – May 2022, long-term rates overtook them for the first time since March 2020. However, this superiority was short-lived, lasting just three months. Following the subsequent downward trend experienced by short-term rates, long-term contract prices decreased from September 2022 through to May 2023, leading to the current situation - with a spread between the short and long market of only 89 USD.
Data-based decisions
Brazil is a textbook example of the kind of challenging market conditions shippers can face, particularly in South America. This can leave them with difficult decisions, such as whether to extend existing long-term contracts and add volumes, or ride the ‘spot rate wave’ with lower volumes and short-term contracts to accommodate sudden changes. Accessing the right data, as we all learnt in the COVID-19 years, is key to making the best business decisions.
With the spread here all but closed at present, it’ll be interesting to see what happens in the coming weeks and months. Stay tuned to the blog and be the first to discover the future market trends as they emerge.
Note:
The 'Weekly Container Rates Update' blog analysis is derived directly from the Xeneta platform. In some instances, it may diverge from the public rates available on the XSI ®-C (Xeneta Shipping Index by Compass, xsi.xeneta.com. Both indices are based on the same Xeneta data set and data quality procedures; however, they differ in their aggregation methodologies.
Want to learn more?
Are you looking for visibility into the volatile container shipping market? Find out how simple it is to get the insights and intelligence you need to make sure you, your team and your business quickly adapt to changing market conditions.
Know instantly how your freight rates compare against the market, justify your transportation costs, prepare for your tender period and report on your success with one powerful easy-to-use platform. Get a demo now!