
This week’s rate update looks to the North American West Coast (WC), shifting the analytical spotlight beyond the US to two other important ports in the region: Manzanillo, Mexico and Vancouver, Canada.
Although the twin Los Angeles ports reign supreme as the main US WC import corridor for containerized goods, their position has been impacted by the ILWU/PMA labor negotiations, which began exactly one year ago this week. The congestion that dogged them throughout the covid-years may have eased but, with no agreement reached as yet, the rerouting of cargo remains a reality. Alternative choice ports have now become accustomed to the increased throughput.
With this in mind, it’s worth looking away from the US EC and US GC to get a full picture of rates developments. Do that, and a special port may catch your eye.
Freight rate developments: Mexican wave drives individual growth
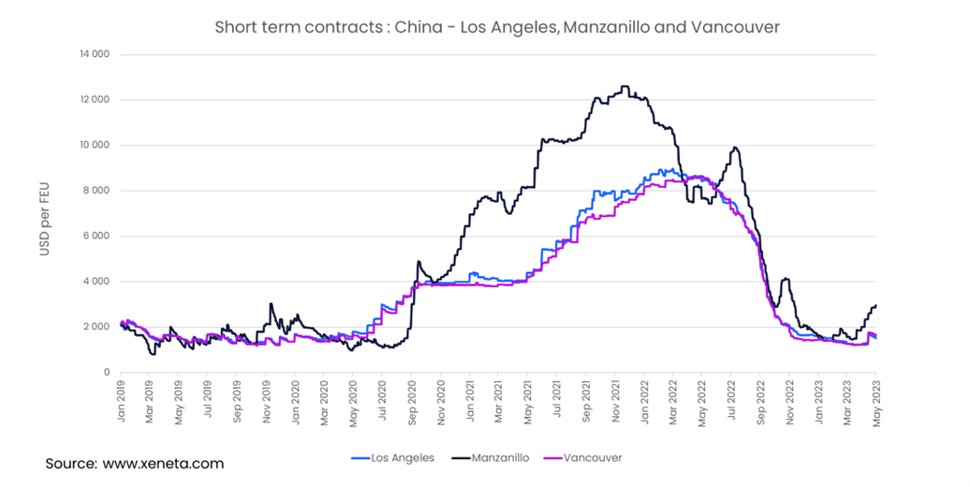
Since 2019, Los Angeles and Vancouver ports have experienced very similar trends in their import spot market from China. Most trades saw increases during 2020 – 2022 and this was reflected on the North American West Coast in general.
However, there is one port that emerges as an outlier when considering market trends; namely Manzanillo Port in Mexico. This is the country’s busiest container port, currently ranking as the 59th largest container port according to Lloyd’s List Top 100.
During 2019, Manzanillo experienced significant pre-covid volatility, as rates swung between USD 1 000 and 3 000 per FEU over the year. However, this volatility would be dwarfed by developments during the Covid years.
In the early days of the dispute, during the first half of 2020, spot rates from China to Manzanillo hit a 14-month low point, diving to 1 185 USD per FEU. This created a ‘negative’ price spread between Manzanillo and Los Angeles Ports/Vancouver. However, this downward trend came to an abrupt halt in September 2020, with the freight rate suddenly undergoing a 32% increase. By the end of that month, Manzanillo commanded spot rates above Los Angeles and Vancouver – a trend that largely continued for the next year and a half.
Manzanillo reached its spot rate peak, 12 618 USD per FEU, at the end of November 2021, standing at 61% more than the equivalent spot rate for Los Angeles. From this point onwards all three ports saw spot rates decline but, yet again, Manzanillo continued to follow an individual path.
By May 2022 spot rates to Manzanillo had fallen back below those of Los Angeles and Vancouver. However, from June through to January 2023 the course was changed as a strong ‘positive’ spread opened up once again.
Turn up the volumes, and the prices
A look at container volumes going into Manzanillo since mid-2022 demonstrates that rerouted cargo from the troubled terminals on the US WC was not only redirected to US EC and GC ports, but also into Mexico. These increased volumes are impacting rates.
Since March 2023, Manzanillo is again opening its spread over the spot rates of Vancouver and Los Angeles. In fact, since January rates to the Mexican hub have increased by 45%, reaching 2 988 USD per FEU in May, almost double that of containers bound for Vancouver and Los Angeles ports. Enhanced volumes are behind the trend, with Far East to Mexico volumes up by 8.1% in Q1 2023 y-o-y. By contrast, imports to Canada and US WC from the Far East are down by 17.5% and 28.4% respectively.
It pays for shippers to be aware of alternative routes and import corridors in the regions to which they are moving their goods, as trends can reveal valuable intelligence about economic developments, foreign investment, and container movements all in one.
Concluding our focus this week, one interesting question remains: is this more than a short-term switch - are shippers considering Manzanillo as an alternative destination to the northwest coast ports for the long run? Time, and the data, will tell.
Note:
The 'Weekly Container Rates Update' blog analysis is derived directly from the Xeneta platform. In some instances, it may diverge from the public rates available on the XSI ®-C (Xeneta Shipping Index by Compass, xsi.xeneta.com. Both indices are based on the same Xeneta data set and data quality procedures; however, they differ in their aggregation methodologies.
Want to learn more?
Are you looking for visibility into the volatile container shipping market? Find out how simple it is to get the insights and intelligence you need to make sure you, your team and your business quickly adapt to changing market conditions.
Know instantly how your freight rates compare against the market, justify your transportation costs, prepare for your tender period and report on your success with one powerful easy-to-use platform. Get a demo now!