


We’re back with a new edition of the Xeneta and Marine Benchmark Carbon Emissions Index (CEI) results. This time, we’ll analyze the Far East–West Coast, which ended Q2 with a CEI score of 82.6. This is a 4.4 index point improvement from the previous quarter.
Q2'23 CEI Carrier Ranking
Far East - US West Coast
|
RANKING |
CARRIER |
CEI SCORE |
| 1 | Maersk | 69.9 |
| 2 | MSC | 70.1 |
| 3 | Evergreen | 72.6 |
| 10 | Matson | 172.9 |
Sometimes, the average CEI score of a trade lane has a better grade than the past quarter due to several continually improving factors. However, in this case, we see the improvement almost entirely linked to an increase in the average size of ships. Compared to Q1 2023, the average size of ships deployed on this trade increased by 11.5%. Ships on this trade lane carried an average of 9,650 TEU in Q2 2023. MSC was the carrier with the biggest ships — they were, on average, 39.9% larger than the trade lane average.
On this trade, the CEI score for two different carriers was very close to one another. Maersk has the best score with 69.9, with MSC in a close second CEI of 70.1. One interesting development is that MSC managed to increase the average size of its ships while still improving their filling factor from Q1 2023 by 5.3 percentage points, but this was not enough to have a better CEI grade than Maersk.
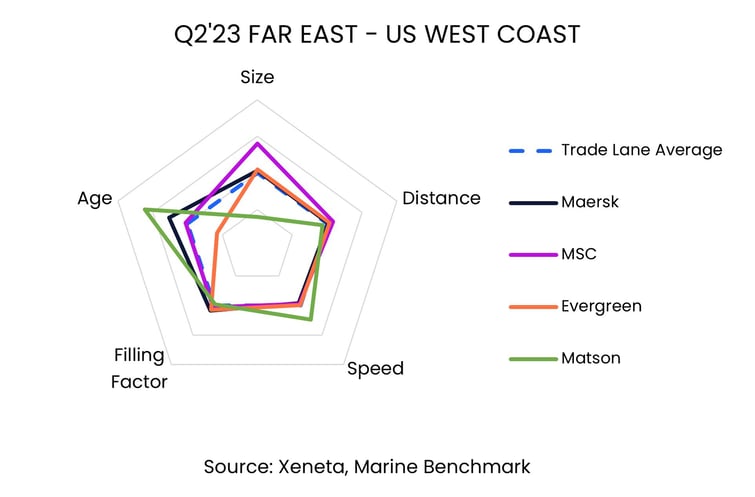
Maersk has ships 36% smaller than the ships deployed by MSC on this trade lane, but they had the best filling factor of the trade, with 86.6%.
On another note, Matson, scored the highest (and therefore worst) CEI grade of 172.9. Matson has been the worst-performing carrier on this trade since Q4 2021. Matson is an interesting case given its model. Its express services on small, older, often poorly filled, and fast ships result in a very high CEI score. Shippers should be aware of the environmental consequences of choosing an express service like the one provided by Matson.
From this data, we can see that on Far East–West Coast, the bigger the boat, the better the CEI score. Of course, this is just a snapshot of the carriers’ carbon intensity during Q2 2023, and we could see very different results as environmental factors change.
For now, Shippers that value reaching their ESG goals should be on the lookout for suppliers with younger, fuller fleets.
Get an honest view of carrier emissions
Stay one step ahead of your competitors by making well-informed and sustainable choices when selecting shipping carriers. Xeneta and Marine Benchmark offer an independent and trustworthy Carbon Emissions Index (CEI) data, ensuring accuracy without any guesswork. By utilizing AIS tracking of real-time sailings on 48 major trade routes worldwide, with coverage expanding further in the near future, you can rely on up-to-date information. Don't settle for outdated and unreliable data. Schedule a demo of the CEI today and begin making intelligent shipping decisions. Get a demo here.

