


We are back with another quarter of winners and losers from the Xeneta and Marine Benchmark Carbon Emissions Index (CEI).
Let’s start with Far East to US East Coast, the trade that has seen the most improvement from the CEI’s first measurement in Q1 2018. In Q2 2023, this lane is registered a CEI score of 76.7 — a 22.3% improvement from Q1 2018. There was a tight race to be crowned the best performing carrier on this trade last quarter: nine carriers scored less than 75 points. ONE came out on top, with a score of 64.6.
Q2'23 CEI Carrier Ranking
Far East - US East Coast
| RANKING |
CARRIER |
CEI SCORE |
| 1 | ONE | 64.6 |
| 2 | YANG MING | 67.6 |
| 3 | CMA CGM | 68.2 |
| 13 | WAN HAI | 100 |
All carriers deploying ships on Far East to US East Coast have registered improvements compared to Q1 2018, one of three of Xeneta’s top 13 trades where this is the case. In fact, even the worst performing carrier in Q2 2023 is, with a score of 100, not emitting more CO2 per tonne of cargo carried than the trade lane average in Q1 2018.
The difference between choosing ONE versus the worst-performing carrier (Wan Hai), would have resulted in a 35.4% reduction in the CO2 emitted per ton of cargo carried. Even better news for shippers? It won’t cost you extra. Looking at the average for all valid long term contracts today Yang Ming’s average rate is USD 100 per FEU lower than the market average.
Of the carriers with ships deployed on this trade in both Q1 2018 and Q2 2023, the improvements in CO2 emitted per tonne of cargo carried, vary from between -2.7%, achieved by Maersk Line to an impressive 39.9% reduction by HMM.
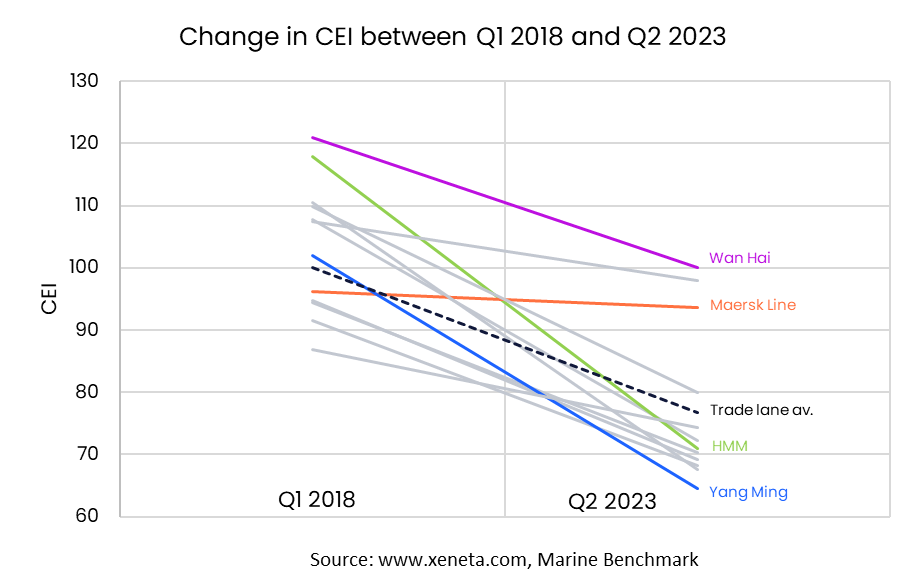
Several underlying variables explain how HMM has achieved a far greater improvement in efficiency than Maersk over the past 6 years.
Firstly, it has to be said that HMM performed considerably worse than Maersk in Q1 2018, with a CEI score of 117.9 compared to 96.2 respectively. However, since then, HMM has increased the average size of ships deployed on this trade by 75.8%, and lowered the average age by a third. Operationally, they have reduced the average speed sailed on this trade by 11.1% and have increased the filling factor by 4%.
In contrast, the ships deployed by Maersk on this trade have seen much smaller improvements. The average size has increased by 9.5%, average age fallen by just 2.8%. Their speed reduction has been lower than that of HMM’s and their filling factor is slightly down compared to 2019.
So, what does this mean? Investing in low-emission carriers pays off in the long run. While some may claim that carbon-efficient sailings are pricier, the data says otherwise. We also see that the size and age of a ship has a considerable difference on a carrier’s emissions. Shippers should have this at the top of their mind when considering suppliers — who has the fleet that will best serve your ESG goals?
Get an honest view of carrier emissions
Stay one step ahead of your competitors by making well-informed and sustainable choices when selecting shipping carriers. Xeneta and Marine Benchmark offer an independent and trustworthy Carbon Emissions Index (CEI) data, ensuring accuracy without any guesswork. By utilizing AIS tracking of real-time sailings on 48 major trade routes worldwide, with coverage expanding further in the near future, you can rely on up-to-date information. Don't settle for outdated and unreliable data. Schedule a demo of the CEI today and begin making intelligent shipping decisions. Get a demo here.

