


We are back with another ranking of carrier carbon emissions based on the Xeneta and Marine Benchmark Carbon Emissions Index (CEI). We like to call it “naming and faming”. This week we are looking at the backhaul trade from the US West Coast to the Far East. In the top spot, and emitting close to half the CO2 per tonne of cargo carrier than the trade lane average is HMM.
Q1'23 CEI Carrier Ranking
US West Coast - Far East
|
RANKING |
CARRIER |
CEI SCORE |
| 1 | HMM | 46.9 |
| 2 | Yang Ming | 68.0 |
| 3 | COSCO | 68.0 |
| 14 | Matson | 197.2 |
In Q1 2023, HMM achieved a score of 46.9 on this trade route, marking its lowest and best result since the inception of the CEI in 2018. HMM outperformed the trade lane average across all major operational variables. The ships they utilized on this route not only exceeded the average size by 22.5%, but they were also notably younger, with an average age of 7.5 years compared to the trade lane average of 11.7 years. HMM's great performance on this trade is attributed to their larger and more modern fleet.
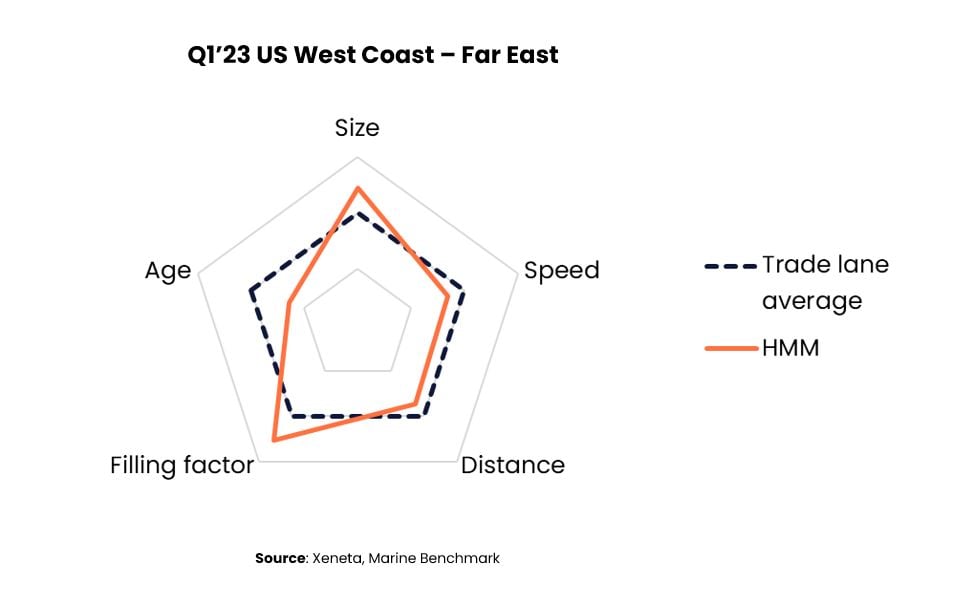
HMM’s ships also sailed on average two knots slower than the rest of the ships on this trade in Q1 2023, and also covered a slightly shorter distance between the ports they were servicing. Furthermore, HMM achieved a significantly higher filling factor on this trade than other carriers.
The US West Coast - Far East trade lane's Carbon Emissions Index (CEI) showed significant improvement, with a quarterly decrease of 11.3% and a year-on-year drop of 18.4%. Notably, the CEI for the US West Coast to Far East route reached an impressive score of 88.0 in Q1 2023, marking its highest result since Q2 2020. Over the past six years, this trade lane has witnessed a remarkable 12% reduction in average CO2 emissions per tonne of cargo transported, based on the Q1 2018 baseline.
The year-on-year improvement in the Carbon Emissions Index (CEI) can be attributed to various operational factors. While the filling factor and distance sailed remain consistent with Q1 2022, a noteworthy change is the average ship size, which has increased by 9.3%. This growth has propelled the average ship size beyond 100,000 DWT (Deadweight Tonnage) for the first time since Q4 2020.
Another significant contributor to the reduction in CO2 emissions is the notable decrease in average sailing speed on this trade route. In Q1 2023, the average speed dropped to 14.4 knots, marking a 2.5 knot decrease compared to the same period last year when ships were sailing at an average speed of 16.9 knots.
Get an honest view of carrier emissions
Stay one step ahead of your competitors by making well-informed and sustainable choices when selecting shipping carriers. Xeneta and Marine Benchmark offer an independent and trustworthy Carbon Emissions Index (CEI) data, ensuring accuracy without any guesswork. By utilizing AIS tracking of real-time sailings on 48 major trade routes worldwide, with coverage expanding further in the near future, you can rely on up-to-date information. Don't settle for outdated and unreliable data. Schedule a demo of the CEI today and begin making intelligent shipping decisions. Get a demo here.

