Our Xeneta Market Insights add-on functionality (powered by Sea-Intelligence data) has received a significant update to Schedule Reliability, Capacity and Blank Sailings data. We now offer a more detailed and granular breakdown of offered capacity and blanked sailings data per Alliance and other carriers to make the data more actionable for strategic supplier planning and tactical capacity adjustments.
Update overview: Xeneta Market Insights for Ocean
- Graph of weekly Capacity & Blank Sailings breakdown for 12 weeks
- Table overview of Alliance and Carrier Capacity & Blank Sailings over 12 weeks
- Table displaying affected services per week including estimated TEU shortfall
- Graph of weekly Capacity & Blank Sailings breakdown per Alliance & other carriers for 12 weeks
Capacity & Blank Sailings
To understand the current capacity availability as well as preparing operational teams for shortfalls of services, the Capacity and Blank Sailings data integration will now deliver a trade lane view of
- Average TEU Capacity over 12 weeks (goal: know the average Capacity that is available on a trade)
- %, as well as an absolute number of TEUs, blanked over the next 12 weeks
- Total number of services blanked over the next 12 weeks
You can now identify if blank sailings programs impact a booked service, estimate the impact on weekly allocation and tactical volume shift between alliances with expanded data granularity towards Alliance and Carrier data. The expandable table view offers :
- Individual Alliance/ Carrier average weekly TEUs
- % and total blanked TEUs
- Number of sailings blanked over the 12 weeks
- Single weeks' affected services (name of service) & related estimated TEU impact by week
For total transparency of capacity availability for single weeks over 12 weeks per Alliance and Carriers, you can also break down Alliance and Carrier Offered/ Available Capacity per week with a toggle function in the existing graph. This will close the information gap for those trades and weeks where no blank sailing is recorded. (Fig. 1)
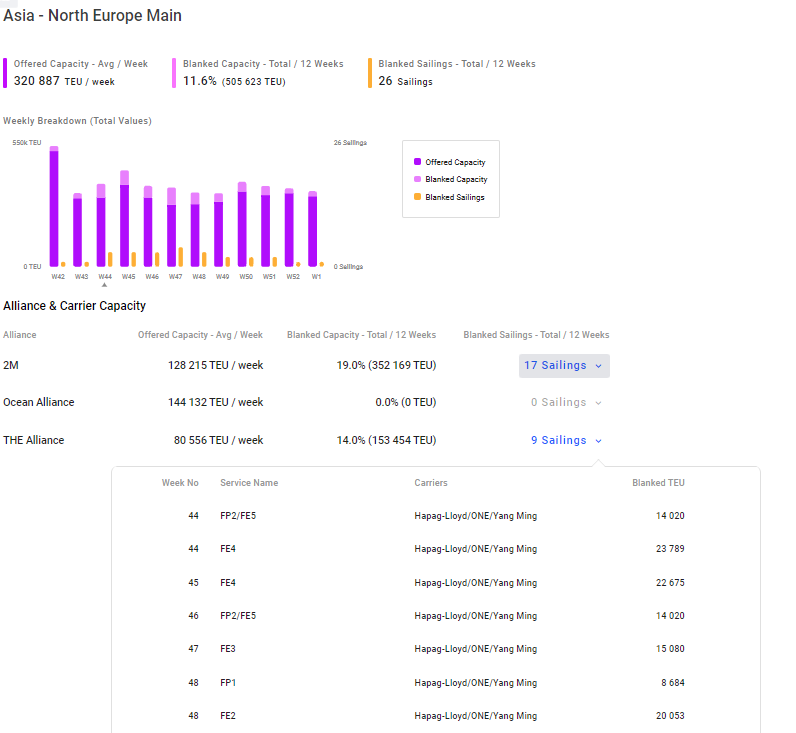
(Fig.1)
Schedule Reliability
You can now benchmark your supplier's on-time performance with the overall trade or other carriers for strategic planning or pick the most consistent carrier with schedule reliability feature. (Fig. 2)
The update included the development of vessel on-time performance per trade lane over the past 12 months in %. You may choose a date to compare the latest performance data with any date back in 12 months. You can also follow individual carriers' on-time performance in comparison to the overall trade lane performance.
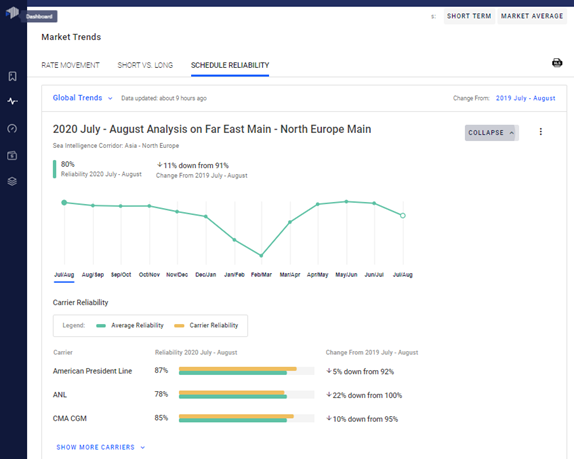 (Fig. 2)
Along with the average on-time performance for all vessel arrivals globally in %, we added a new data set displaying the average days of late vessel arrivals globally and per trade lane. This update will allow you to benchmark trade and carrier performance against the global average and identify critical late vessel arrivals for better inventory planning. (Fig. 3)
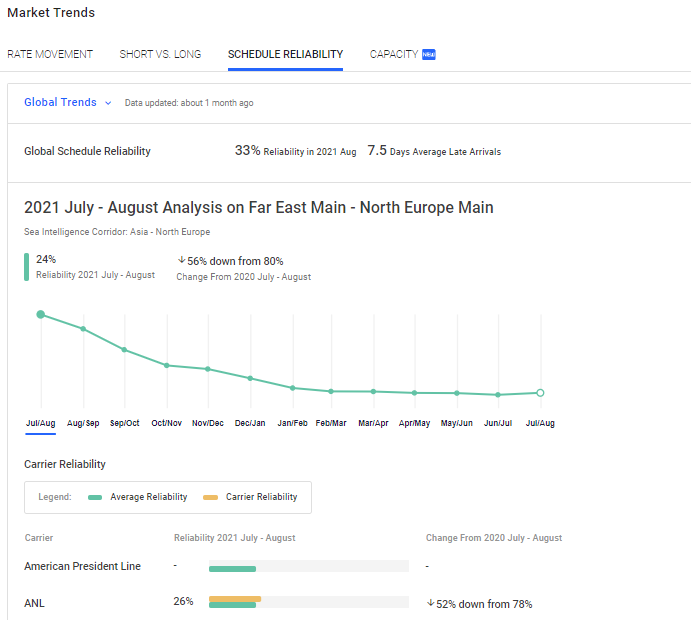 (Fig. 3)
Want to learn more about Xeneta Market Insights? Request your free demo now.