With volatility still a constant in ocean freight shipping securing competitive contract rates is a huge headache for shippers. While businesses may think that they have optimized rates by focusing on negotiating door-to-door rates, they are often missing out on cost-saving opportunities and procurement optimization best practices.
These are hidden within the different phases of the shipping process - as the adage goes, the devil is in the detail.
So, to lock in not only those budgeted cost savings, but to also be able to report on rise in costs and assess risks, companies need to do more. They need to do their homework. They need to utilize analytical tools to ensure that they’re securing the most competitive freight rates. Navigating this complex market requires the right tools and partners.

Rethinking Shipping Routes
When considering the process of ocean shipping, it’s often easiest to break it down into three phases, or legs.
The first leg (pre-carriage) is before the container is delivered to the port or terminal. The second leg (carriage) is the transition from port to port. Lastly, the third leg (on-carriage) is after the container is picked up from the subsequent terminal. Together, this door-to-door transit accounts for about 90 percent of world trade.
In ocean shipping, the port-to-port delivery represents a significant part of the total cost of a shipment, and from a price point of view, that is the most volatile part of the “three-legged shipping route.” As such, the case is strong for shippers to understand and benchmark how their ocean shipping rates compare to the market, as they have a significant impact on their bottom line.
The pre-carriage, the inland movements BEFORE the container is delivered to the shipping ports and the inland movement AFTER the container is picked up from the shipping ports, offer their own opportunities for shippers. Navigating these legs of the transit require a lot more than just comparing container shipping rates chart. Local companies at both origin and destination, as well as at local ports command the most up-to-date information on port and market conditions, meaning potentially better pricing and a higher level of services for shippers.
The issue is, that if it is not controlled and monitored properly, the door-to-port and/or port-to-door legs may push shipping rates above market costs and drag port-to-port benchmarking shippers into less favorable agreements with carriers. Shippers may end up with poor service, longer transit, and product lead times with shipments stalling in ports, and higher inventory carrying costs.
Moreover, the pre and on-carriage legs offer multiple opportunities. For example, shippers can choose between different modes of transportation such as rail, road or barge and they can opt for the transportation activity to be performed by either the shipping line (carrier haulage), by the client, or by their transporter (merchant haulage).

Overcoming Volatility
It is within the Carriage-leg (port-to-port) that pricing is the most volatile. However, that same market volatility provides opportunities for shippers to negotiate better, more competitive rates. In fact, our platform now holds more than 200million data points and is reporting rates for 160 thousand port-port pairs.
There’s good reason to make detailed and actionable analytics part of your ocean freight procurement strategy. According to a survey conducted by American Shipper, ocean freight is the single most effective mode to apply analytics.
A great example of market volatility was discussed in Reuter’s coverage of Amazon’s Beijing Century Joyo, and its plans to charge customers between $530 and $2,530 to transport a 40-foot dry van container from Shanghai to Hamburg. According to the article, the rate is comparable to those charged by other forwarders, and the wide range would give it the flexibility to adjust its prices based on volume.
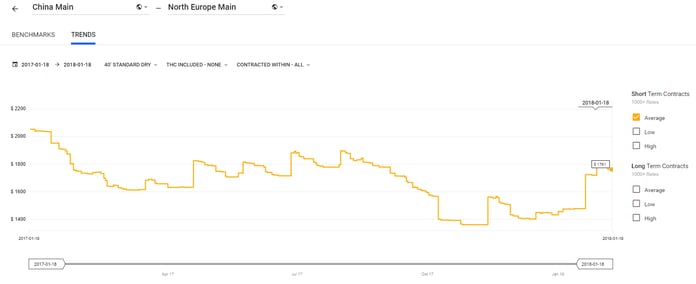
Looking at Xeneta's data referring to the graph below. During the period of January 2017 - January 2018, the market average rate for trade between China Main ports and North Europe Main ports peaked above USD 2000, took a dive to just above USD 1600 in the spring with various ups and downs supported by several GRIs and not before it bottomed to below USD 1400 in Q4 2018.
[Click to enlarge]
 Figure 1: Datasource & image from Xeneta platform
While we saw a strong end for suppliers in the end of 2016 and early 2017, the end of last year did see the buyer sitting in a more optimistic seat. With Chinese New Year 2018 about a month away, we are seeing rates tick up again on the major corridors. This is also represented in the graph above where we see that January 2018 rates for China Main to North Europe main ports report market average rates at USD1787 and above for a 40' container.
This real-time data in market movements provides the much-needed market intelligence that has been missing for all stakeholders in the industry, especially buyers.
Buyers need to understand the market dynamics within the volatile ocean freight market in order to make the right supplier and contracting-type decisions which is vital in a global environment that is surrounded by much uncertainty and risk driven by socio-economical factors. Although spot market rates tend to be the most volatile, buyers must monitor long-term rates as well, because long-term trends in most cases are influences by the spot market, and will have implications to buyers’ procurement strategy.
Xeneta’s platform provides the right tools to make educated decisions lane by lane to not only keep an eye on current market movements, but to derive data needed to support procurement activities such as RFQs, supplier negotiations, target setting, cargo risk assessment, budgeting of future freight costs, justification of cost increases and a lot more challenges sourcing teams face.
To learn more about the advantages of benchmarking ocean freight rates port-to-port and to see how your ocean freight procurement strategy can benefit from the market intelligence Xeneta provides, we encourage you to join our upcoming webinar.
.png)


