

With access to better data, the shipping industry has implemented a globalized revenue optimization model. During one of the featured sessions at Xeneta's annual customer summit last year, Erik Devetak, CPO at Xeneta, analyzed the effects of data-driven decision-making on global and local supply chains.
Previously, global supply chains were considered relatively independent. The Trans-Pacific trade was considered independent of China to the Europe trade. The ocean freight market was supposed to be unaffected by the air market.
However, that's no longer the case. Due to changing ecosystems of global economies, these markets now respond to each other continuously.
If we use the Covid-19 crisis as a baseline, many new correlations appeared alongside the obvious shock to the supply chain. When the first Covid wave hit, there was a huge amount of fiscal stimulus, particularly in the US, which translated into a significantly higher volume of goods and expenditure on goods.
But what did it mean for shipping? Towards the end of 2021, there was massive congestion in the US ports. The waiting time increased, and congestion affected the freight rates as they rose to historic levels.
Highlighting the correlation between the market before and after the pandemic, Erik noted that even after the drop in rates towards the end of Q2 2022, prices were still up 400% in November 2022 compared to pre-pandemic. As per Maersk data (including CTS Data), the estimated volumes of North American imports in the first half of 2022 were up almost 30%.
Is transpacific trade independent of European trade?
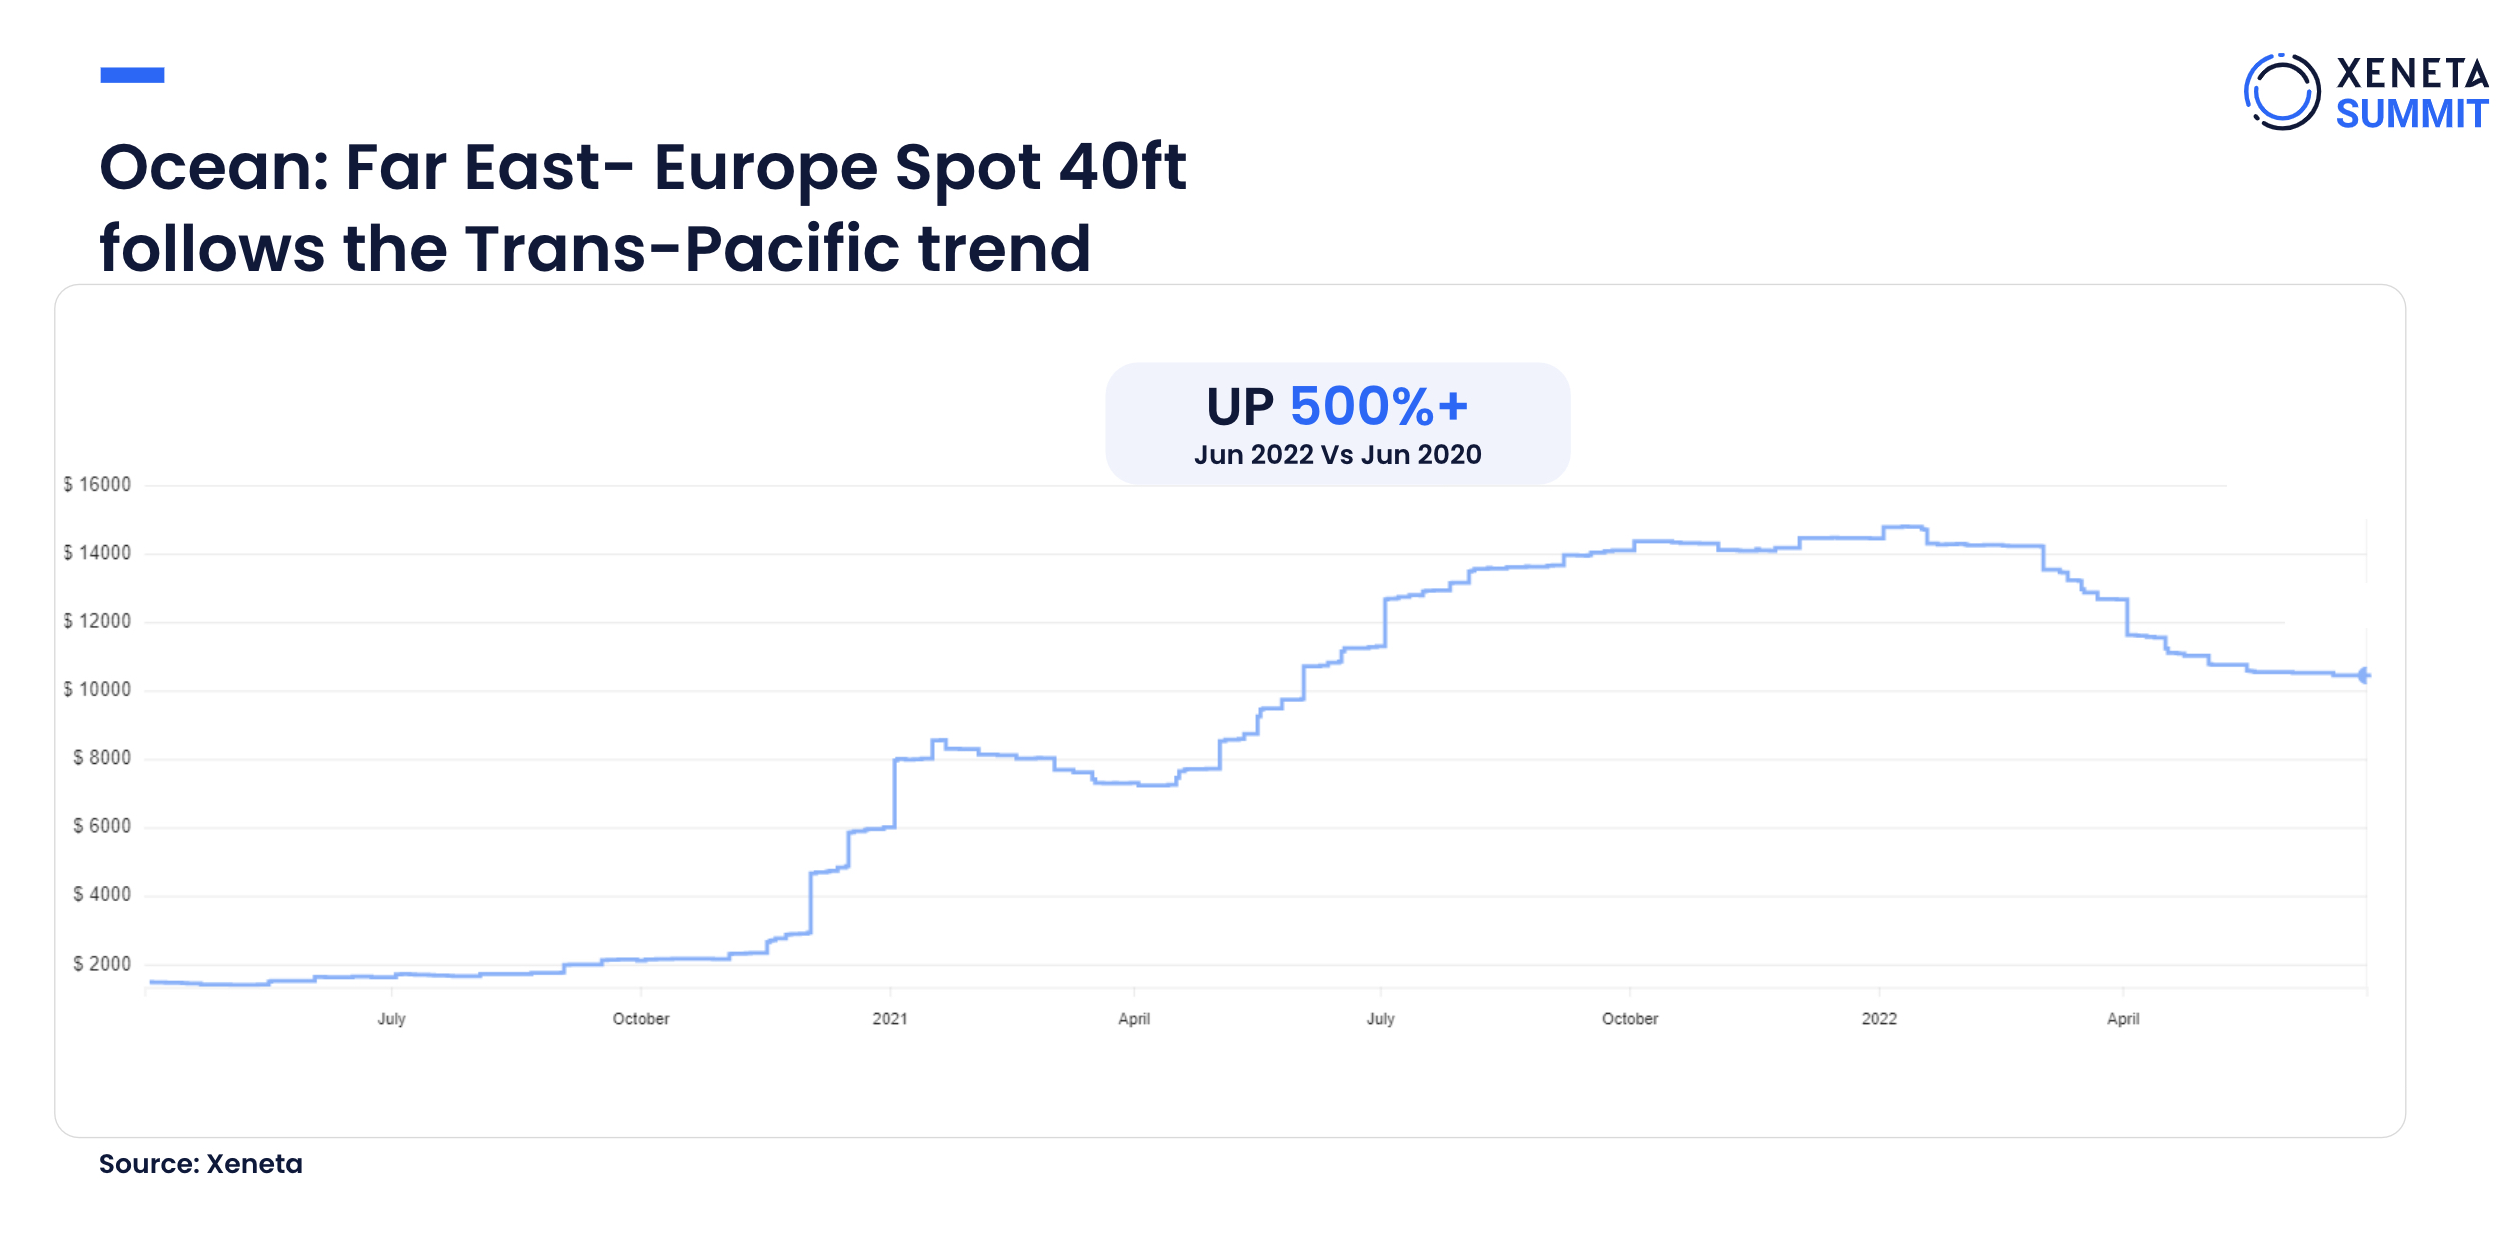
European volumes at the beginning of 2022 were identical to pre-pandemic volumes. And even though the rates in H1 2022 were also like pre-pandemic levels, that was not the case throughout the year. From the Far East to Europe, the spot rates were up by 500% as of Nov 2022 compared to the ones in the Trans-Pacific.
Volumes into Africa were stable, but prices were still up. Similarly, if we look anywhere in the world, we can find traces of impacts from the Trans-Pacific trade.
Erik suggests the only way to explain this correlation is by considering the optimization of the profits and the ideal location of the carriers' assets. So effectively, we were propagating a situation out of Los Angeles on a global stage. This caused Los Angeles port congestion to influence the European market more than the US import.
For example, while comparing profits for sending a ship between Shanghai and Los Angeles or Shanghai and Rotterdam for the same $10,000 - the profits would be better in Los Angeles. Even if congestion causes two weeks' waiting time in front of Los Angeles at the same price, shipping into Los Angeles would be efficient for carriers as they save on fuel and could turn around the ships faster. Hence, carriers will optimize their global revenues by shipping into Los Angeles instead of shipping it into Europe.
So, we cannot look at transpacific trade as independent of European trade.
Also, the profitability between these two trades was almost identical in H2 2022. This indicated that data has propagated to a level where carriers can have identical profitability in very different market conditions on most global trades.
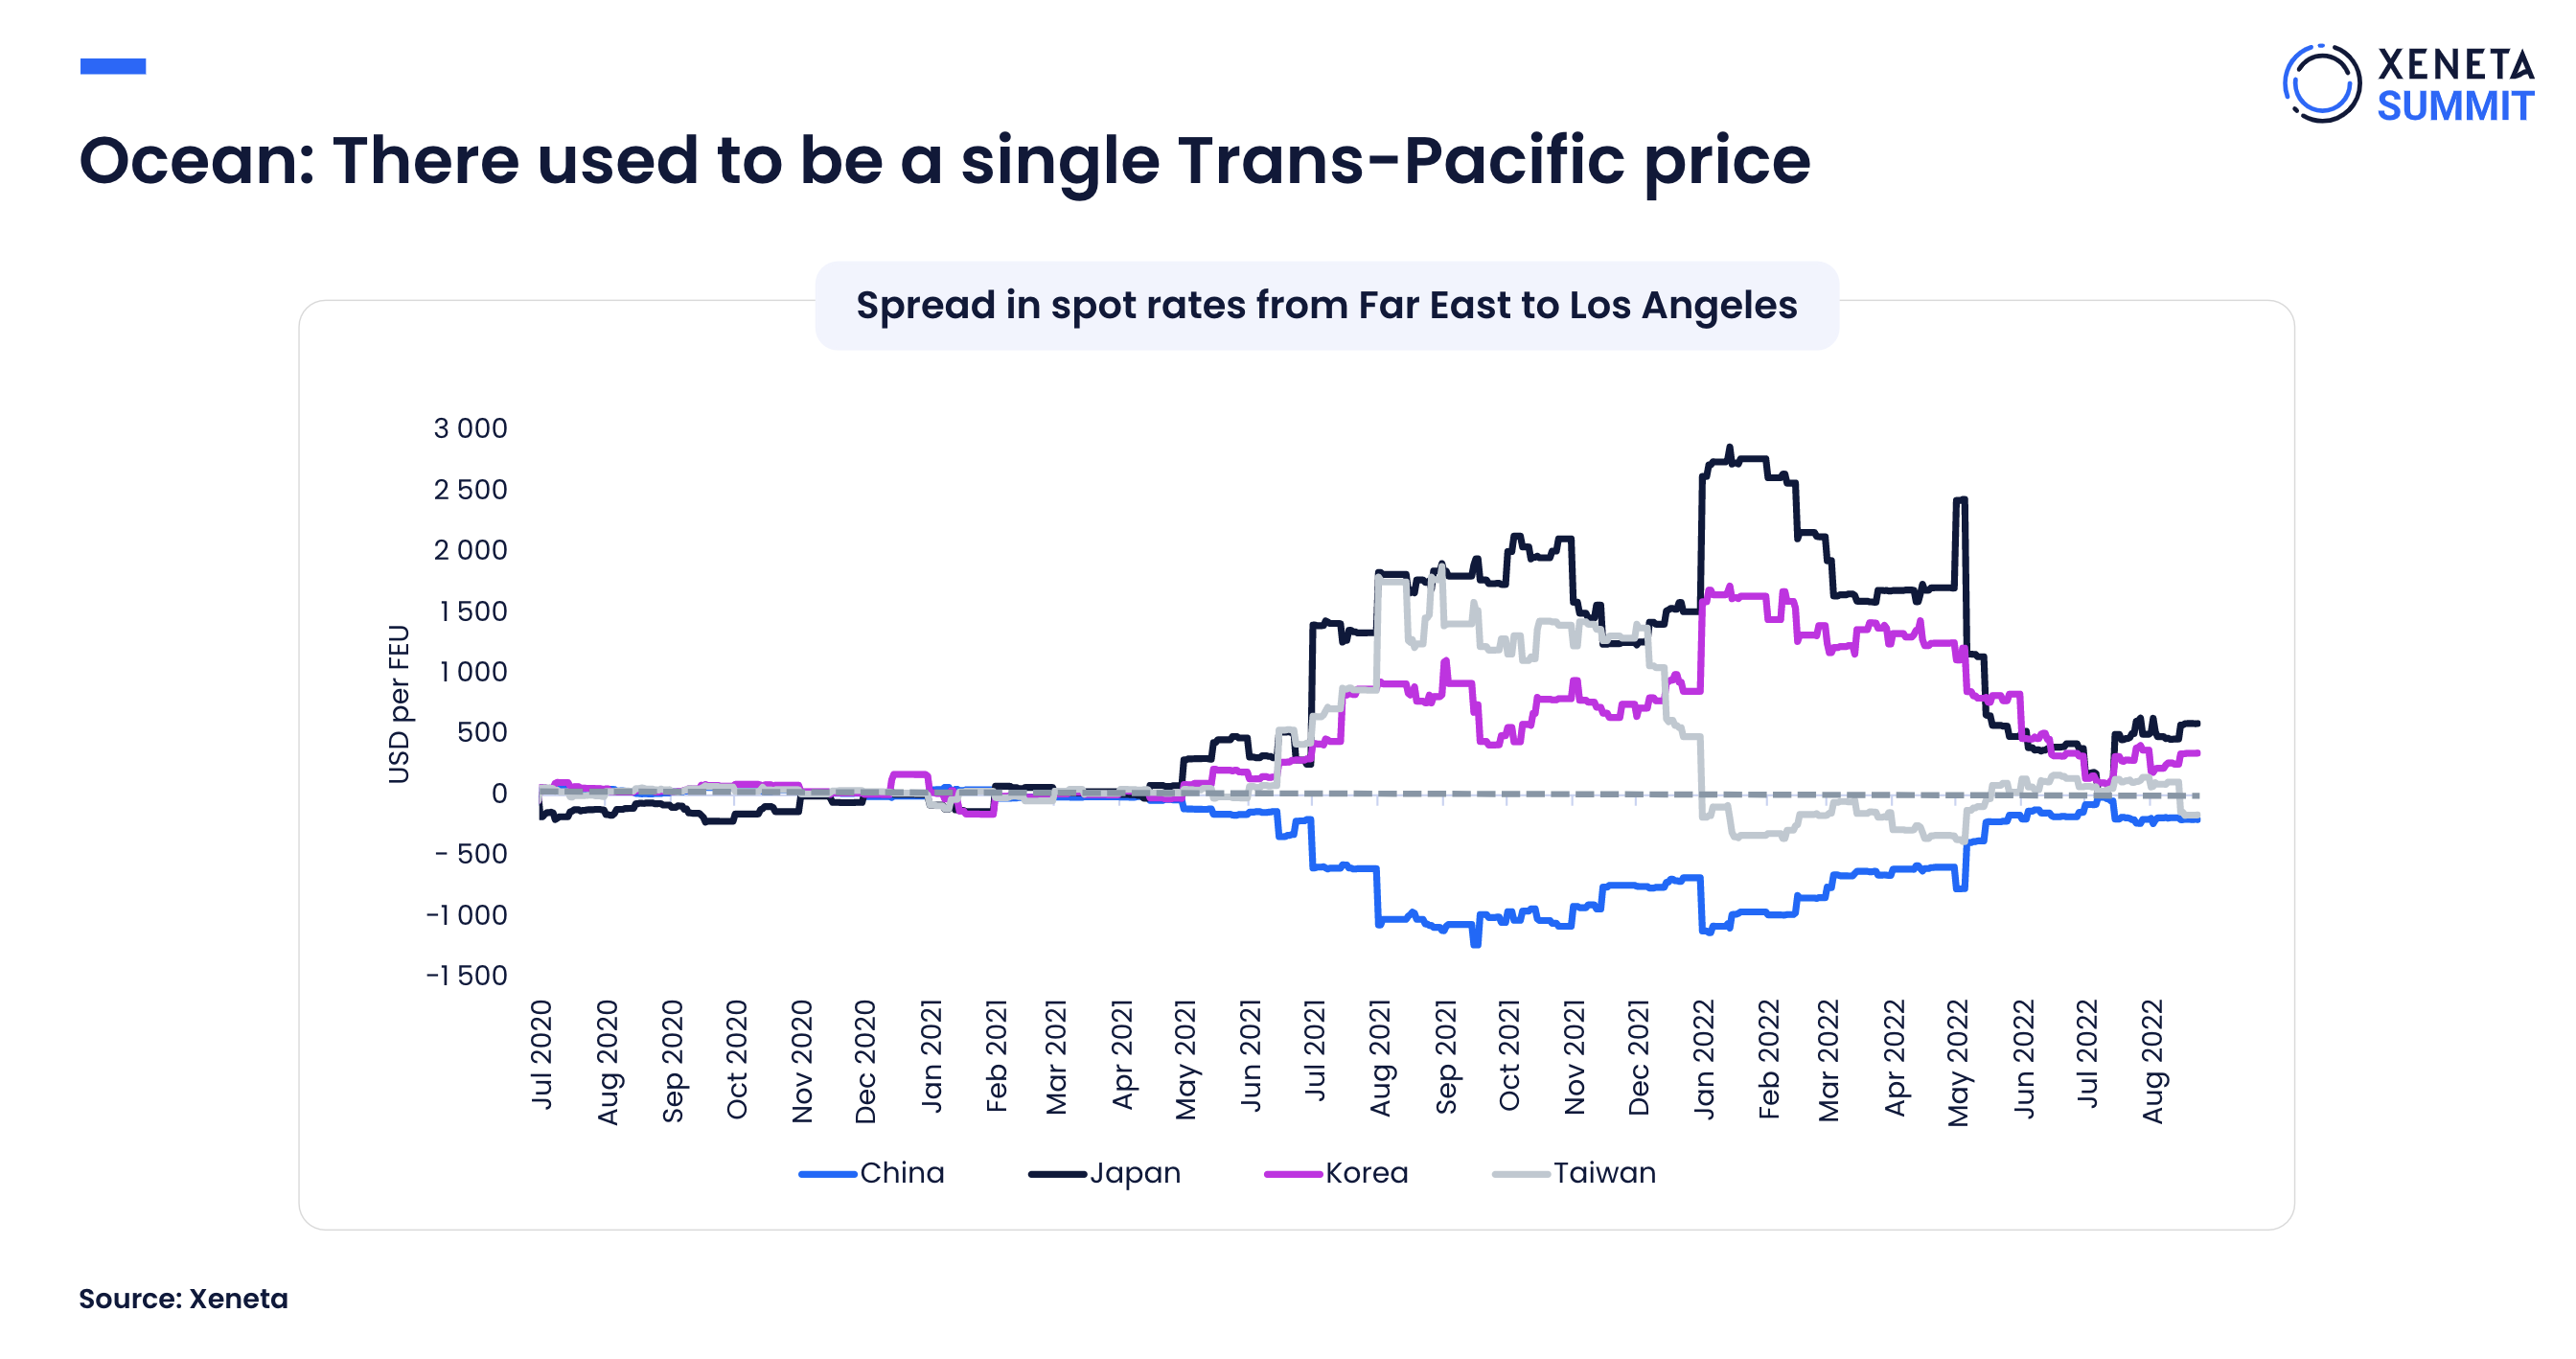
There used to be a single Trans-Pacific price, but not anymore.
We can see multiple other cases of global optimization of trade routes, profits and prices.
For example, pre-pandemic, there was no difference in prices when shipping into Los Angeles from either China, Japan, Korea or Taiwan. But since Covid, after a certain point, China got nearly $4000-$5000 cheaper than shipping from Japan.
Carriers started to demand a premium to stop at other locations between China and Los Angeles. They had an infinite supply of goods in Shanghai at one point and could send a filled ship back to Los Angeles as quickly as they wanted. So, trades that were already correlated saw changes in their prices to reflect the cost of stopping at any specific location.
In the same example, Erik pointed out that the spread between different prices started to fall once the supply from China decreased. Now, carriers needed to stop at multiple locations to avoid sending the ship half-empty.
But we have always seen such price differentials, so what's the common thread connecting these price changes? Well, it's data.
With access to the relevant data, it's easier for suppliers to propagate:
- The costs into the proper rate prices
- The actual cost of multiple stops in a journey
Does this correlation exist only for ocean freight prices?
The short answer is no. It expands beyond ocean shipping to air freight as well.
How can the propagation of data allow the interconnection of trades & lead to different results for different industries?
When looking at the length of the air contracts in 2021, amidst a significantly volatile market due to supply chain constraints, we saw freight forwarders trying to reduce their risk by offering short-term rates.
However, it was a slightly different structure for the ocean market, where there was direct interaction with the carriers.
As per the Maersk investor report from Q4 2021, the target for long-term contracts for Maersk in 2022 was 70%. So, Maersk had moved from 46% pre-pandemic to 70% long-term contract in 2022. Even with a similar market situation with volumes or capacity constraints, the slightly different structure of the industry can lead to different results. In the ocean industry, there is a direct BCO/carrier relationship, and carriers usually choose to lock in the profits if possible.
But what happens to freight forwarders in the same industry?
As per Xeneta data for the number of contracts going via freight forwarders or BCOs in 2021 and 2022, we could see freight forwarders wanted to avoid the risk of volatility.
June 2022 saw a slight turn in the market. FF rates returned as the market went down, and there was a perception of lower volatility or risk.
For example, the ocean volumes of K+N were down in 2020 and 2021, indicating the unwillingness to take a risk. However, the air volumes during the same period were up by 30%, even with existing air constraints, such as disappearing belly cargo in 2021.
So, even with the same increased propagation of the data and capacity to make the decisions for global optimization, we would still end up with different results.
Trades, or any modes of transportation for that matter, are hugely interlinked and can no longer be considered independent.
'It is difficult to explain what happened in Europe during the first half of 2020 without thinking of a global asset and pricing optimization of carriers across all of their assets,' said Erik.
He also emphasized that it is not enough to understand the data. The data for the above two markets was very similar, yet they yielded different results. It is also significant to comprehend how markets could develop over time and what risks different market players would face.
Covid has proved the power of data by showing us how to move away from single trades to optimize profits, routes, or assets on a global level.
Even though there will be very different market conditions in the coming years for the tender season for the spot market, the importance of data and the capacity for global optimizations will stay.
Having the right data and being able to interpret the same data is going to become a notable competitive advantage for all industry players.
Want to learn more?
Watch the latest monthly State of the Market Webinar to stay on top of the latest market developments and learn how changing market conditions might affect your contract negotiations.