


-1.jpg)
In our October 2017 webinar, Michael Braun, Value Engineering Director at Xeneta presented Xeneta's October quarterly ocean freight rates live. He analysed the Q3 2017 rates on Asia - Europe (in/out) as well as the Trans-Pacific. He also explained on why benchmarking is essential to justify costs savings in the volatile ocean freight rates market. He did a 12-month analysis of historical rates for the spot and long-term market and drew correlations between the two markets to give inidications of what to watch out for in the coming quarters.
Webinar - Ocean Freight Shipping Prices Review
- Presentation transcript: Read below (or download full transcript in PDF format)
- Live Q&A session: Read answers to common questions from the webinar
Presentation Transcript
[Michael Braun]:
Todays Agenda
Katherine Barrios: [00:08] My name is Katherine Barrios. I'm the CMO as Xeneta, and I'm joined today by my colleague Michael Braun. He's a Director of Value Engineering.
[00:20] If you've joined our webinars before, you may have not seen Michael. This is Michael's first webinar with us. Welcome, Michael.
Michael Braun: [00:29] Hello.
Katherine: [00:31] He is sitting in Heidelberg, Germany. I am sitting in Oslo, Norway. Michael's been with us since around April this year. He comes with extensive background in ocean freight, over 10 years' experience, so we're happy to have him on board.
[00:45] Some small housekeeping items. This webinar is scheduled to be 25 minutes plus 5 minutes of Q&A. You can ask questions via the panel on the right‑hand side, where you just look for questions. You can type your questions in, and we will answer your questions towards the end of the webinar.
[01:05] If we're unable to answer your question and we run out of time, we will reply to you over email. Another thing is that we're recording the webinar, so you will get that recording by tomorrow, where we hope you can re‑listen to it again or share with your colleagues and forward it. We appreciate that very much.
[01:26] I don't have any additional things. If we move on then to our agenda and what we're going to cover today, we have over 300 people scheduled for today's webinar. The levels of knowledge of Xeneta varies, so we do need to do a quick overview of Xeneta, of what value we bring and an introduction to the company.
[01:49] Then we're going to go through some of the rates through the past quarter in Q3, looking at the main trade lanes, and looking at some exciting things that have been happening lately. That is of interest for you, especially for those that are entering into your negotiation periods for the Asia Europe route.
[02:07] Michael will do some closing remarks, and then we'll take the questions at the end.
[02:15] I hope everyone can hear. If you are having trouble with the sound, we do have a call‑in number, which we can paste the link into the chat window and you can dial in via phone, as well.
[02:29] Good. At this point, I will hand it over to Michael, and we'll get started.
Michael: [02:34] Thanks very much, Kathy. Hello everybody, once again, also from my side.
[02:39] As we have a lot of new people onboard, we're actually close to 100, I would like to give a very quick and brief overview on our company, and also the latest figures, so that the ones which have not been yet familiar with us get a very quick introduction. Then, of course, we will move on, onto the more interesting part to look a little bit into our recent perceptions of the ocean freight market.
[03:03] What are we doing? What is Xeneta? We are actually founded 2012 in Norway by two people, Patrick Berglund and Thomas Sørbø, which were, at that point of time, absolutely convinced that there was too less transparency in the ocean freight market and that we need to have a kind of a platform where every partner on the market can get trusted information on how the ocean freight market is moving and what kind of development is perceived by everybody.
[03:31] Today, three, or four, or five years later, we have now over 700 companies, 2,000 users regularly using our tool, accessing our platform, and actually looking on the data we provide.
[03:44] We have offices in Oslo, in Boston, and in Hamburg to be closer to our partners. That will further encompass the development of our company, which is, of course, quite good.
[03:55] Whom do we serve? We serve all partners in the industry. We serve freight forwarders, we serve carriers, and we serve shippers. Shippers from all industries, from forest, from automotive, mining, chemicals, industrial, consumers. There's a wide bunch.
[04:13] We are not specialized in anything, because we are convinced that all of the partners participating in the market, shipping containers all around the world, are more or less participating in the same markets. That's why we are open for all applicable industries, and in that way also trying to serve them all in the very best way.
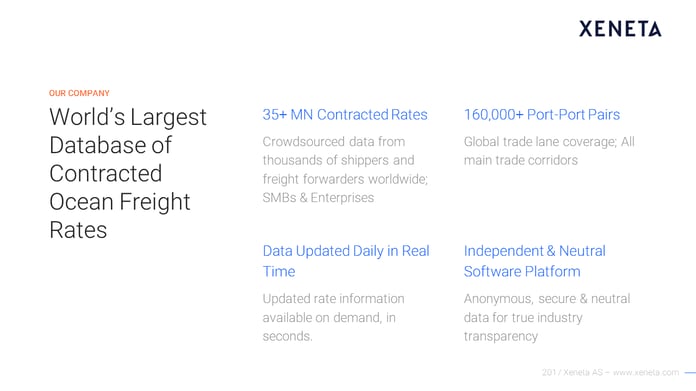
[04:33] Today we account for, what we say, the largest database of contracted ocean freight rates in the world. We have now around 35 million contracted rates in our database. A contracted rate, for us, is a specific price, on a specific O‑D port pair, with a specific equipment type for example, reefer and standard dry containers for a given time frame.
[04:58] Sometimes short term, less than a month, two weeks, mainly by freight forwarders, or longer‑term contracts, typically three months, six months, and mostly one year, which are then normally supplied by the shippers and DCO base.
[05:14] All of this database, together, it accounts today for 160,000 port pairs all around the globe. We have a coverage not only on the main trades, which we are going to look at today, but also all of the outlying trades ‑‑ Africa, South America cross‑trade ‑‑ so that global shippers all around the world can access the information they need for their own proposals.
[05:38] In this context, this is also important to mention - data information, which is updated daily and in real time, meaning that we get a constant influx of new rate agreements coming in from our shipper space, from the freight forward space, so that you are always able to access the latest rate information, up to the very same day.
[06:01] Not looking back three months, six months, or whatever, but really looking into the market, especially on the short‑term side, what is recently happening within the last couple of days.
[06:11] This also already giving you a kind of a hint what we are going today, because we will definitely look at the recent market development, up to the beginning of October, this month, so that you really get the latest information available.
[06:25] In this context, last thing what I would like to mention about our company is that we are independent and neutral, meaning that the software is developed on our own, the data is stored on our own, and we are not at all linked with any player in the industry. In that way, independently serving carriers, freight forwarders, and shippers in the very same way.
[06:50] Now, what are we actually doing, or what are you going to see today? Our aim is to give a complete overview on contracted rates, starting from the port of destination, including the port handling, together with the shipment on the ocean, and then the handling on the destination side, as well.
[07:09] Contracted, as I said, long‑term rates from the shipper space, plus from the freight forwarders, mostly NAC and FAK rates, so to have a very, very full and round picture on all available rate levels on the market, so then to you supply short‑term and long‑term rate levels at the very same time.
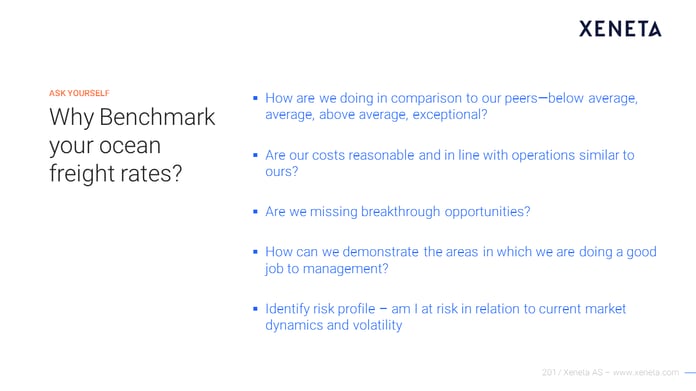
[07:33] The biggest purpose, what we see with our market development, is really to give you an applicable picture of the latest market levels, and also to give you a measure at hand to benchmark your own preferments.
[07:49] Because it's always good to have a good market picture by doing, for example, a tender and comparing the rate levels of the various bits, but it's always been hard to evaluate how good their own preferment still is if you are lacking the comparison with other peer companies, or at least other members on the ocean freight market.
[08:10] Our goal is really to provide a platform that you can access costs of other partners at the same level of geography, at the same time, not six months ago, where the market has perhaps been on a completely different position, so that you really can identify opportunities on specific regions or on specific other areas, where you see that you are lagging behind, or where you can improve, compared to others.
[08:38] As we are tracking it on a daily basis, you can also follow up your development and your improvements over time from one tender to the other.
[08:47] In addition to that, you also have areas where you are perhaps not active today, but with our data you are able to access this information from the other partners, of course in an anonymous way, so that you can also identify, on the one side, budget information for new lanes coming up, as well as identify potential risks in case the market is going up and you are spending a big portion of your overall budget on this specific market area.
[09:19] All in all, we see our platform as the most powerful tool for benchmarking ocean freight rates in the world. Another point where we think it is extremely important to have market information available is to report savings.
[09:35] All of you which are in the procurement business usually need to report saving towards your procurement units, which is, of course quite easy and quite able to do if you are in a falling market or if you develop over time in a constant market. Then you can, perhaps generate one or the other percent of operational savings.
[09:56] What are you doing if a market is going up by 15 or 20 percent, as it is with the volatile ocean freight market, where you can have these kinds of developments within a very, very short time. Other peer companies in the same industry are perhaps lucky for having already contracted rates, which were done in a very good market position.
[10:17] Now, you are caught in an up‑going market environment. You are confronted with rate increases. You still are supposed to usually report savings to procurement department. Here, our independent and neutral market information comes in place.
[10:33] If we can prove to you that the overall market has gone up by 15 percent, while you have only a rate increase of 12, this is a significant and important saving you can report to your stakeholders.
[10:45] That's why we think that it's absolutely essential to always follow the market in close relationship, to be aware of this overall market environment, especially as the volatility in the ocean freight market is really unforeseen and also not as comparable with most of the other buying commodities throughout the business worlds.
[11:10] This is where we see our playing field, where we see we can provide assets, where we can provide market intelligence for the use of our clients, especially in the context of the supply chain and the procurement people.
[11:24] Now, to cut a long story short, we are not here to only do our selling of our idea of the business, but of course also to provide you with some kind of content and information that we are using our tools. What I'm going to show you now is a little bit of quick insight into our tool, what it looks like.
[11:44] We will address one specific market, so that you get an example of what it looks like. Then I will show you a couple of additional analyses throughout or into it, so that you get the feeling a little bit of what kind of information you can derive from our platform and how it can be helpful in addressing the market development.
Michael: [12:30] This is a typical picture of one given market, what we are able to display you within the Xeneta platform. We can access the market on a global level.
[12:43] At this moment, we are really looking at the high‑level overview, Far East main ports, all of the main ports which have direct services with Europe and, then, on the other side, the corresponding ports in northern Europe, for example, Hamburg, Rotterdam and Antwerp and so on.
[12:58] Just to give you an estimation, we have over here an enormous selection of regions, of ports, of countries. You have a lot of different possibilities to go into all various port pairs to address the information, when you become a customer of our tool.
[13:16] You have the possibility to filter to different equipment types. You have the possibility to accept the long or the short‑term market, as to fit it to your own buying methodology, in this context, applying for if you have terminal handling charges included or not, depending on your buying approach.
[13:41] When we then look at the market development, you will see a couple of very similar graphs now in due time, we usually display you at the one site the best‑in‑class market level, the market low that we see within our database and then, in parallel, the market average, to see how the market is moving throughout time
[14:05] In this specific example now, for the last year, starting October, 2016, showing the rate peak until the end of the year, having little bit up and downs, as of today's time, with the latest data you can see over here, today's date.
[14:21] This is the typical example of things that we can provide you on, as I said, 160,000 port pairs of the world. Apart from that, what is also able to be displayed is that we are not only showing the market itself, but we are also showing your own market environment.
[14:49] On the right side, you can see there are a lot of different shippers' names being applicable. At the moment, when you have specific contracts in place, you're also able to then display these contracts and compare them with the market development in order to see if you are better off or worse off with one or the other contract and if you need to improve within the next tender.
[15:14] As you can see, some contracts can be short‑term, changing very soon, on a monthly basis. Other contracts can be long‑term, of course being stable. To see that, for example, having a very good contract at a certain time is, of course, when the market is moving up.
[15:31] I'll blank the other ones out, so we can follow it more easily. If the market is going up, it is quite sure that, after this contract runs out, you will probably not be able to repeat the same market level again, a couple of months later.
[15:46] This is one of the typical kinds of advantages we can provide you with, having our market intelligence as a side base, in order to get an overview on how the markets are moving and probably how your future rate levels will look at the end of a contract and also to justify internally.
[16:07] This is pretty much the database we are addressing here, where our information comes from. As we are today talking about two specific markets, I will now switch over, because I have prepared a couple of analysis so that we can address this kind of information.
[16:52] Here we are. Check that everybody has the picture. The first market we are going to look at is Far East Main to North Europe Main. When I go into the platform, you will now see exactly the same picture that we have just seen a minute ago, just with the difference that it's now put on a PowerPoint, so I'm better able to mark a couple of things, so that we don't need to go into the tool and as I have already prepared.
[17:28] What you now see here and this is one of the typical analyses you can do with our tool, is the mirroring of the short and the long‑term market throughout the last couple of years. Fair East Main to North Europe Main, those of you who are active in the market know that it's usually an extremely volatile market, which can be clearly seen by the short‑term market development going up and down, especially in 2015 and 2016.
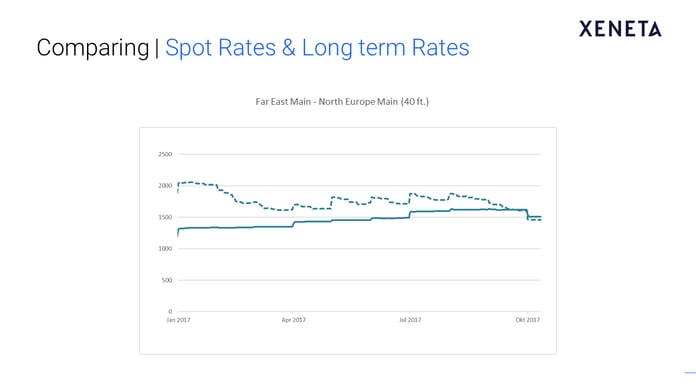
[17:57] In addition to that, what I have also played in it is the long‑term market, the steady line in the same time. As you can see, long‑term market is following short‑term market, with the specific delays, when the market is also going down, but always with a kind of delay of a couple of weeks or a couple of months. Usually the short‑term market is driving the development of the long‑term market in this context.
[18:22] When we now look into this specific market and the development of the last couple of months, we can see that quite compared and different to the years before, where we had a constant up and down of incredible general rate increases on the one side and then sharp drops following.
[18:40] As usual, these couldn't be held by the market. Throughout the last 12 months, we got a different picture, because we first had the situation in 2016 that the general rate increases were quite successful. The market was going up on a constant level.
[18:56] In addition to that especially for 2017, the market has been extremely stable and not at all as volatile as the years before. As you can see, throughout the last couple of weeks and months, there have hardly been any further general rate increases and, if yes, they were only on a limited scale.
[19:17] The rate levels were quite stable throughout the last six or seven months. The long‑term market, in parallel, moved up continuously, following up this short‑term trend, but still with the advantage that the short‑term market remained above the long‑term market throughout the last couple of months.
[19:37] Compared to the years before, where you were sometimes better off or not, throughout the last 12 months, it was definitely like this, that the long‑term market was constantly increasing. But it was always below the short‑term market.
[19:49] We looked at the situation a quarter ago. There was no signal at all that this kind of upwards trend could add any position change or that we would see any other kind of signal from the market and this kind of steady, continuous upward trend.
[20:08] This has now significantly changed throughout the last couple of weeks. The recent weeks have clearly shown that, at the worst time, there wasn't any more successful general rate increase. We can see a sharp drop of the short‑term market development going down from around US $1800 to US $1500, going together to the long‑term market levels again.
[20:34] You can also see that the long‑term market recently has also dropped already a little bit, following this trend. For the first time for 18 months, we have the short and the long‑term market on the same level, which is a significant change compared to development of the last couple of months.
[20:54] It will be extremely interesting to see what this recent market development will now mean for the market development in the future. This is especially the case, as, when we go into the development of the previous years, you can see that in one year it went down, 2015. 2016 it went up.
[21:19] It is hard to predict where the new market is going. Everybody is clearly advised to have a very, very close look at the newest short‑term market development, up towards the end of the year. This will have a significant impact on the next tender round and on the 2018 rate behavior.
[21:38] As you can see, in '15 and '16, the overall long‑term rate levels were significantly lower than in 2017. It will be extremely important to follow how the short‑term market is now moving, compared to the previous times. This will more‑or‑less have an impact on how the long‑term market will react throughout the next time.
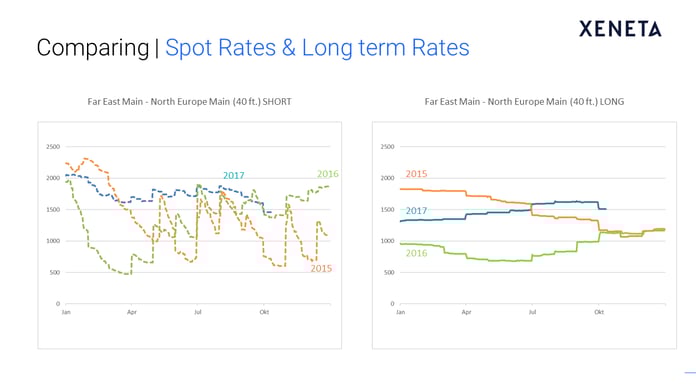
[22:02] Everybody watching today, we can clearly advise to have a very, very close look at the next short‑term market, because it will more‑or‑less give an estimation to where the tender season is heading. At the moment, it's very, very hard to predict. But it's clearly stated that something is happening.
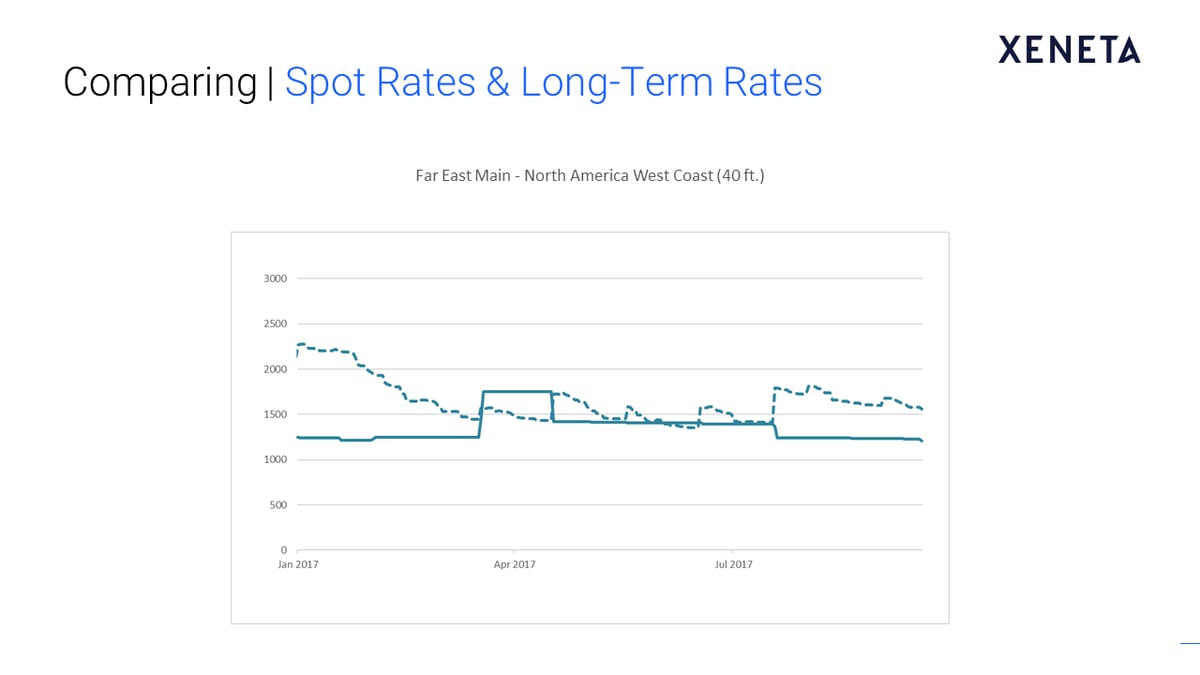
[22:19] The latest trend is more downturn. But it needs to be seen if this is stable or not. The other market we would like to focus on today is the trans‑Pacific. Here, compared to the trans‑Atlantic, we had a more and more stable market environment, throughout the last years.
[22:36] There was an up‑and‑down in the short‑term market. But the long‑term market stayed more or less extremely stable, especially if we look at the recent 12 months. There had been some uproar at the beginning. But, since then, the short‑term market had gone down.
[22:53] We had a more‑or‑less stable development of both markets throughout the summer. This has changed, after the summer break, when there was a general rate increase in place on the short‑term market, but which you can already see was not at all successful to also pull through in the long‑term market.
[23:10] There are two things. Either the long‑term market is following the short‑term market or what has happened now, in recent weeks, the general rate increase was not proved to be successful, staying and continuous.
[23:22] In that way now, we have seen in recent weeks that this previous general rate increase has more‑or‑less now vanished. The short‑term market is now more‑or‑less again moving towards the long‑term market, already cutting off two‑thirds of the increase it has previously had.
[23:42] At the moment, we see here that the markets are again similar to Europe, close to each other. But it's also the same thing, it needs to be followed very, very closely on how its development will go on, towards the upcoming tender season.
[23:59] The global economic figures for the US are quite good. The consumer industry especially is looking forward to the Thanksgiving and Christmas seasons this year. It will be interesting to see if these growing volumes will have a significant impact on the rate level, or if we'll stay on this current consolidated level.
[24:18] When you hear, compared to the last two years, you can clearly see that, after these kinds of channel rate increases, in the October season, shortly before Thanksgiving in both years we saw a significant drop towards the end of the year, already having an implication for the tender season coming up.
[24:35] It will be seen if we have a parallel development this year, most probably leading to a very, very constant long‑term market again or if we'll see successful general rate increases coming up, in line with the fact that probably sales volumes or transport volumes are going up by this year.
[24:57] Parallel to the Asia to Europe trade, it's too early to predict where the rest of the year is going. Especially the short‑term market needs to be followed very, very closely. That's also my point for the time closing it, having it, showing the recent developments over the three months.
[25:16] You have seen, especially in Asia, recently something special has happened. Now it's advised, in both trades, to really have a very, very close look at the future development.
[31:42] In relation to what Michael was mentioned today on what we're seeing with the short‑term rates going below the long‑term rates for Asia, Europe, and also trends for the transpacific, about half hour ago we posted a blog about that. Click here to read the blog post.
[31:56] I encourage you to follow us on our blog at Xeneta Blog and sign up to get notifications. We post frequently on there, so you'll see that blog if you log on now. Also, make sure to sign up to our newsletter.
[32:13] We will be having, towards the end of the year, a wrap‑up of 2017 that we'll do as a video broadcast that we'll send out to everyone. We'll do that together with our co‑founders, Patrick and Thomas, and hopefully Michael, as well. We will send you email communication so you're aware of that and when that happens.
[32:32] Please, feel free to reach out if you have any questions. We will get back to you and answer any questions that we didn't get to today.
[32:38] That's it for now. Thanks a lot for joining, and we'll see you next time.

Questions and Answers
Q1) How do you receive spot rates?
A1) That's quite easy. 99 percent of our spot rates are provided by the freight forwarder advice. Usually, BCO's only go for long‑term contracts. When it comes to long‑term contracts, our base of supply are usually the BCOs and the shipper side. For spot rates, it's the freight forwarder side.
Q2) How does the database delineate the significant variation in rates between commodities? Are there any ratings given to provide an accurate benchmark?
A2) The clear answer to that, we do not rate or manipulate any data. We take the market information as we get it overall. Our database today is so big, having thousands and tens of thousands. In the example I showed you, we had 50,000 contracted rates behind this specific one. There is no risk at all. We constantly track that specific industries or specific commodities pull it up or down. We mirror a picture of the overall market, clearly displaying all of the partners in a way that you can be sure that this is the overall market.
Clearly speaking, we have done these kinds of additional analyses for our customers in separate events. The variations that we see within industries and within commodities, through the market development and the performance of the players, is significantly higher than the variations between commodities.
In that way, we are absolutely sure that the averages we display in the market are not deviated by any specific commodity.
Q3) Can you plug your own contracted rates in the tool?
A3) Yes, you can. That was exactly what I did in this simulation at the very beginning, when I clicked on the specific carrier name. This would have been your own contract. You are able to mirror and implement your own contracts into the database, so that you see your own development of rates, compared to the overall market.
Q4) Do you do similar benchmarking on road?
A4) No, we don't, because the road market is completely differently structured. What we are going to do and we are just developing this, with the roll‑out in 2018, is global air freight. Air freight will come in due course, road freight, not in the foreseeable future.
Q5) How do you envisage the impact of 22,000 TU vessels in 2018 and the stability of the alliance?
A5) In general, I would not say that you will see CVs with 22,000 TU will now have a significantly larger impact than already the influx of 18 or 20,000 TU ships coming in for the last couple of months and years. We will definitely have an overall impact. Rate levels will be on a constant volatility. I don't think that the market will stabilize. I don't see a certain point for the instability of the alliances at the moment, because they are already quite settled now, with only a few remaining.
The only point that we see is that we are not really sure if these ultra‑large vessels will really always reach the level of utilization they should have in order to harvest the economies of scale they produce with the larger size.
I would say that we will see a lot of volatility again. I don't think that we will see a general instability in the market. "No new lines only?" I definitely don't see any of them dropping out, which is now remaining.
Q6) Will you ever track door‑to‑door rates?
A6) We do in some way track it, when it comes to inland US terminals. But when it comes down to the specific location on the inland side, the markets are extremely deviating.
It also comes to different pre and non‑carriage modes of transport, which is, of course, also leading to the fact that it's not comparable anymore. That's why, at least in due course, we will not go in that direction. We will concentrate on the ocean‑to‑ocean or terminal‑to‑terminal flows.
Q7) Is it the same rate level for Europe‑Far East main direction?
A7) No, definitely not. Two completely different markets. If you are having volume there, today we concentrated on Far East to Europe and the transpacific.
We always pick different rates applying to the interest of different customers, so the chances are high that for the next session, in three months, we also go for Europe to Far East again.
If you are interested in our tool and you want to have more insights in other markets, or especially become a customer, then you will, of course, also get access to the Europe to Far East trade in this context.
###
If you missed any our webinars – or simply want to refresh your memory – you can access all of them on demand here.
See you next time!


