
All eyes were on Germany in May 2023, with Transport Logistic 2023 and Air Cargo Europe 2023 in Munich a natural focal point for buyers and sellers of logistics in Europe and beyond. With this in mind, Xeneta’s Weekly Rate Update for ocean transportation takes an in-depth look at the essential export corridors for intra-European and extra-European container shipping.
European containerized exports (measured in TEU) is usually seen as the baby brother to imports, but, as shown by 2022’s figures, there’s not much difference between the two. Last year 24.2m TEUs entered the European region, whereas 20.9m TEUs exited. Intra-regional trade amounted to 8.2m TEU (source: CTS).
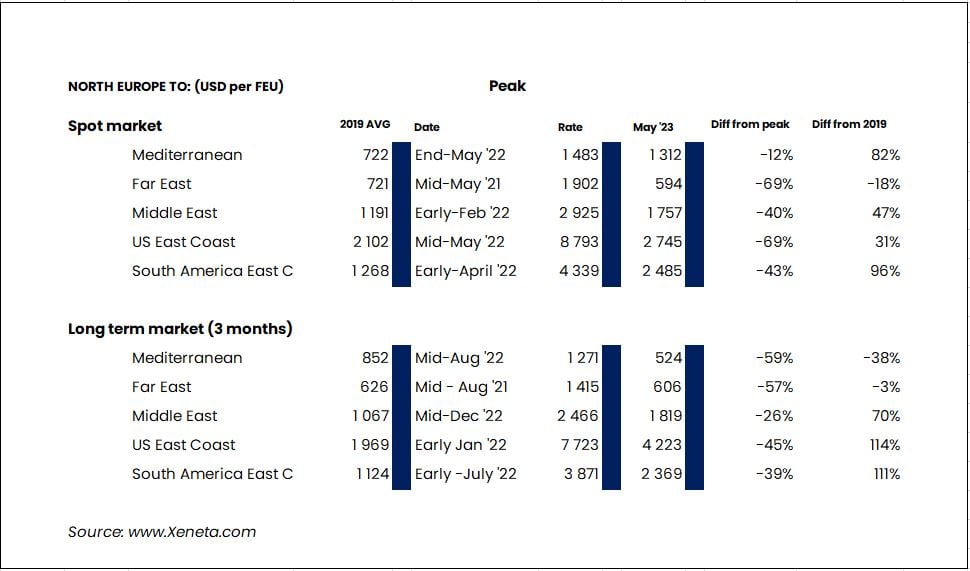
Across the five main export corridors from North Europe – to the Mediterranean, Far East, Middle East, US East Coast (US EC) and South American East Coast – Xeneta’s data illustrates a shifting rates landscape, with some similarities and an array of individual trends.
Hitting the Spot – down but not out
Spot rates have had a rough ride since hitting market highs last year, with substantial drops across all the main trades. However, the scale of those falls differs markedly from corridor to corridor.
For example, whereas the corridor into the Mediterranean – stretching from Algeciras in the west to the Sea of Marmara in the east - has fallen ‘only’ 12%, the corridors to the Far East and the US EC are down by 69% from their respective peaks.
The North Europe to US EC trade is the market’s biggest casualty in absolute dollar terms. Spot rates in early May were USD 2 745 per FEU, a collapse of USD 6 000 per FEU since mid-May 2022. Shifting to drops in percentage points, the largest extra-European corridor, to the Far East, is the main loser. Spot prices for the trade are now just under USD 600 per FEU, equivalent to 18% below the pre-pandemic average of 2019 (69% down year-on-year).
Shippers exporting cargoes to the Middle East and South American East Coast faced their respective peak prices in early February and early April 2022. Since that point rates have tumbled 40% and 43% for the two routes.
Although these falls are substantial, rates are still far above their pre-pandemic levels. South American East Coast exports were 96% more expensive in early May 2023 than in 2019, while rates to the Middle East were 47% up for the same period.
Long-term declines, but stand-out performers emerge
A look at long-term contracts signed within the last three months reveals a clear trend. An overall average for the market shows a drop of 45% (against peak prices), ranging from a 26% decline on the Middle East bound trade, to a fall of 59% on the short haul to the Mediterranean.
However, when comparing prices to pre-pandemic levels two trades stand out, with rates in early May more than 100% above 2019 levels. The trans-Atlantic front haul to US EC, a corridor that has seemingly defied gravity in recent times, is 114% up, while the relatively minor but essential North-South Atlantic trade into Brazil, and more generally the South American East Coast, also shows triple digit growth (up 111% for the South American EC).
The back haul Europe to Far East corridor is now on a par with pre-pandemic pricing, sitting at USD 606 per FEU (just 3% down on the USD 626 per FEU recorded in 2019). At its peak, in mid-August 2021, rates had climbed 126% from 2019, to USD 1 415 per FEU.
The only trade with rates significantly below 2019 levels is the shortest of them all, to the Mediterranean. Currently at USD 524 per FEU, this market climbed by 49% to its peak in mid-August 2021, and has since fallen by 59%. In early-May, rates are USD 328 per FEU below the average of 2019.
Note:
The 'Weekly Container Rates Update' blog analysis is derived directly from the Xeneta platform. In some instances, it may diverge from the public rates available on the XSI ®-C (Xeneta Shipping Index by Compass, xsi.xeneta.com. Both indices are based on the same Xeneta data set and data quality procedures; however, they differ in their aggregation methodologies.
Want to learn more?
Are you looking for visibility into the volatile container shipping market? Find out how simple it is to get the insights and intelligence you need to make sure you, your team and your business quickly adapt to changing market conditions.
Know instantly how your freight rates compare against the market, justify your transportation costs, prepare for your tender period and report on your success with one powerful easy-to-use platform. Get a demo now!