Far East fronthauls – a key battleground for carriers to protect profitability.
When analyzing the ocean freight shipping industry, our gaze often falls on fronthaul spot rates from the Far East – the world’s manufacturing powerhouse and driver of global trade.
2023 has been a year marked by lower shipping volumes coupled with increased capacity. But what impact have these market dynamics had on spot rates out of the Far East?
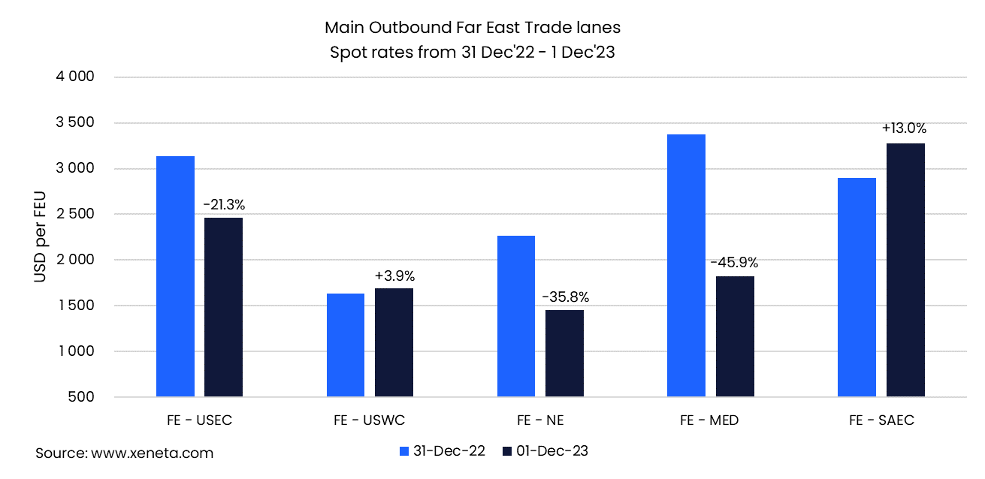
Firstly, let’s take a look at spot rates from the Far East into the Mediterranean, which fell by 45.9% between 31 December 2022 and 1 December 2023 to stand at USD 1 826 per FEU. This is the biggest decline in spot rates on the Far East fronthauls.
We also saw a significant decrease in spot rates on the Far East to North Europe trade, which fell by 35.8% during the same period.
Increase in capacity puts downward pressure on rates
As is often the case, the decline in rates from the Far East to Mediterranean can be accounted for by an increase in capacity, which on this trade stands at 20.6%. Between the Far East and North Europe, capacity increased by a more modest 4.2%.
Capacity increased by 20.6% on the Far East to Mediterranean fronthaul (source: Sea Intelligence) and demand increased by 21.0% between January and October compared to the year before (source: CTS). On the fronthaul into North Europe, demand fell by 0.9% in the same period.
Rates on the up into South America East Coast
The Far East to South America East Coast trade saw the largest increase in spot rates, rising by 13.0% between 31 December 2022 and 1 December 2023 to stand at USD 3 276 per FEU.
This trade also saw an increase in container movements (demand), which was up by 13.1% between January and October 2023 compared to the previous year. With deployed capacity only increasing by 4.2% during the same period, it is not surprising to see spot rates increase to the extent witnessed.
Declining volumes into the US
In terms of demand, the US East Coast inbound volumes were the hardest hit this year with a 13.3% decline. There was also a 9.8% decline in volumes to the US West Coast.
At the same time, capacity to the US East Coast increased by 4.2% from January to October 2023 when compared to last year, while capacity to the US West Coast fell by 5.8%. These shifts can be seen reflected in spot rates between 31 December 2022 and 1 December 2023, which declined by 21.3% to the US East Coast and increased by 3.9% to the US West Coast.
This is a good example of the impact capacity management has across trade lanes and is a theme which will continue to play out in the market during 2024 as carriers battle to protect service profitability.
As another year draws towards a close, over the next few weeks Xeneta will continue to look back at some of the biggest stories and developments in ocean freight shipping in 2023. Make sure you don’t miss it!
Read more about Xeneta 2024 Ocean Shipping Outlook
Want to learn more?
Contact us to learn how Xeneta can help you prepare for this upcoming tender season and supplier/buyer negotiations. Gain the upper hand with actionable real-time ocean and air freight rate and capacity data.