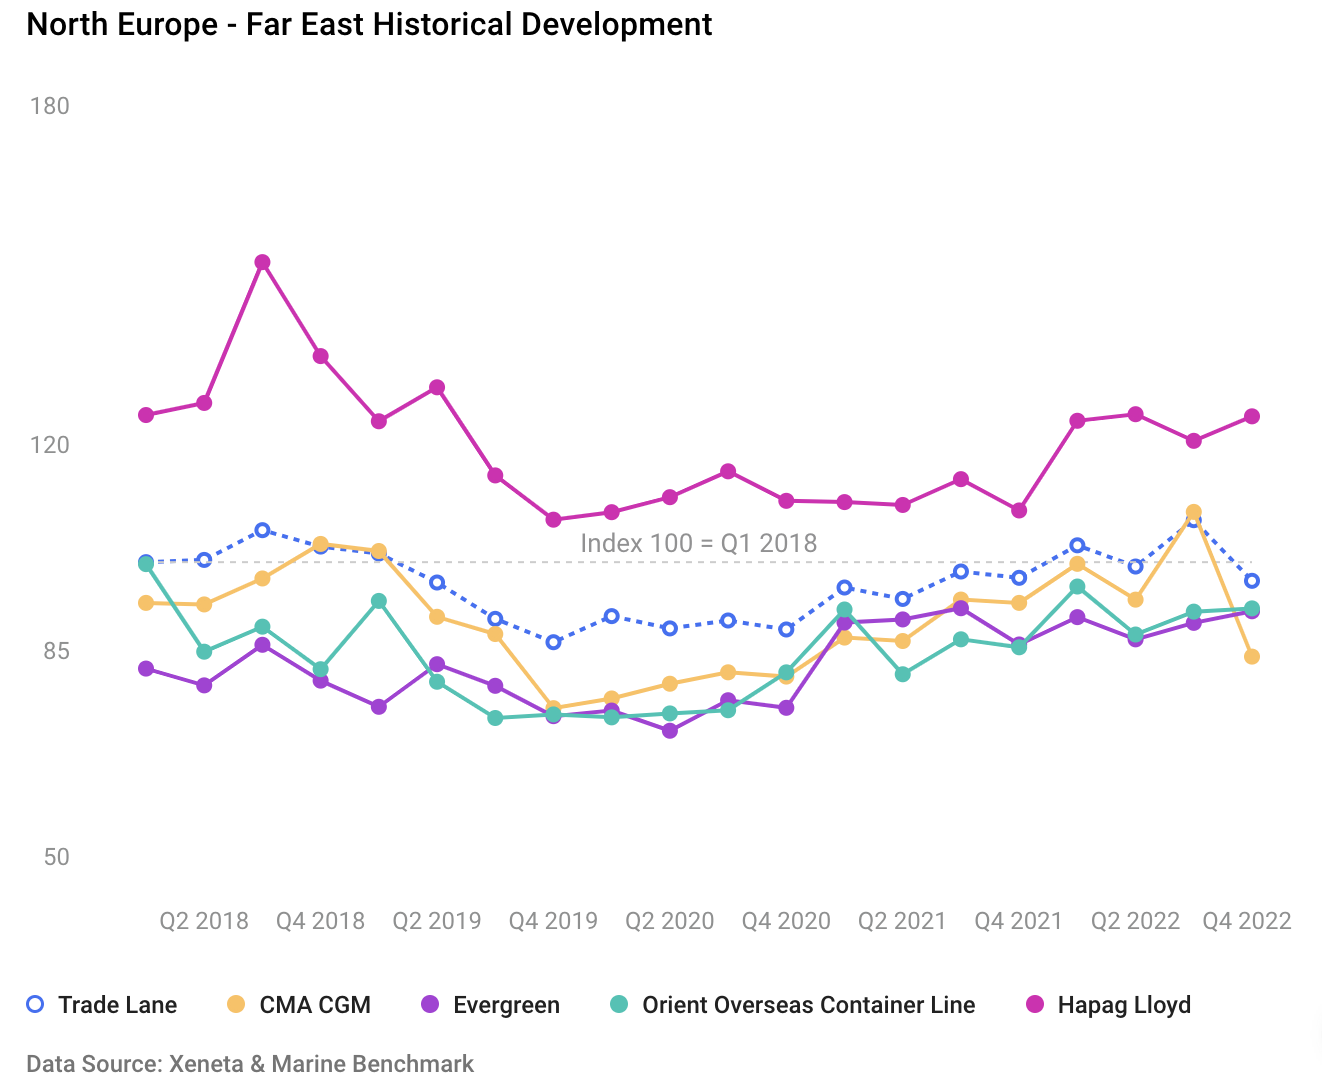
We are back with another ranking of carrier carbon emissions based on the Xeneta and Marine Benchmark Carbon Emissions Index (CEI). We like to call it "naming and faming". This week we are taking a look at North Europe to Far East trade.
In Q4 2022, the Carbon Emission Index (CEI) by Xeneta and Marine Benchmark on North Europe to Far East corridor reached its lowest level since Q2 2021, hitting a score of 96.8.
Q4'22 CEI Carrier Ranking
North Europe to Far East
|
RANKING |
CARRIER |
CEI SCORE |
| 1 | CMA CGM | 83.9 |
| 2 | Evergreen | 91.6 |
| 3 | Orient Overseas Container Line | 92.1 |
| 10 | Hapag Lloyd | 124.8 |
This CEI score represents an increase of 12.0% from its pre-pandemic Q4 2019 level, leveraging a new normal and representing a 0.5% improvement from Q4 2021. The improvement is partly due to the average speed on this trade dropping by 9.3% from the previous quarter to 15.2%.
Furthermore, this corridor was one of the few that saw its filling factor increase by 9 percentage points from Q3 2022.
The most carbon-efficient carrier between North Europe and the Far East in Q4 2022 was CMA CGM with a score of 83.9.
The score is 13% lower than the carrier’s past quarter mark of 108.6 and 13% lower than the trade lane average in Q4.
Despite the improvement compared to the previous quarter, CMA CGM’s CEI score was 11.5% higher in Q4 2022 than in Q4 2019.

CMA CGM’s quarter-on-quarter improvement was largely due to a 17.6% drop in the average speed of its ships deployed on this trade and a 5.3 percentage point increase in its filling factor.
As well as a higher filling factor, CMA CGM’s ships were 5% bigger than the average sailing from North Europe to the Far East.
Get an honest view of carrier emissions
CEI data powered by Xeneta and Marine Benchmark makes no assumptions and is independent from carriers. It's sourced from AIS tracking of actual sailings, currently covering 13 of the world’s biggest trades, with more being added in the coming months. Find out how you can factor sustainability into your carrier selection and get a demo of the CEI here.
.png)


