


We are back with another ranking of carrier carbon emissions based on the Xeneta and Marine Benchmark Carbon Emissions Index (CEI). We like to call it "naming and faming". This week we are taking a look at the very popular and timely Far East to US West Coast trade.
"Why are we doing this?" We want to shine a light on the importance of green shipping and spotlight the progress of carriers.
It's important that there is a neutral dataset that illustrates this for the industry. We're in the game of transparency.
We believe that emissions data like ours is a crucial part of the pricing discussion between shippers and carriers.
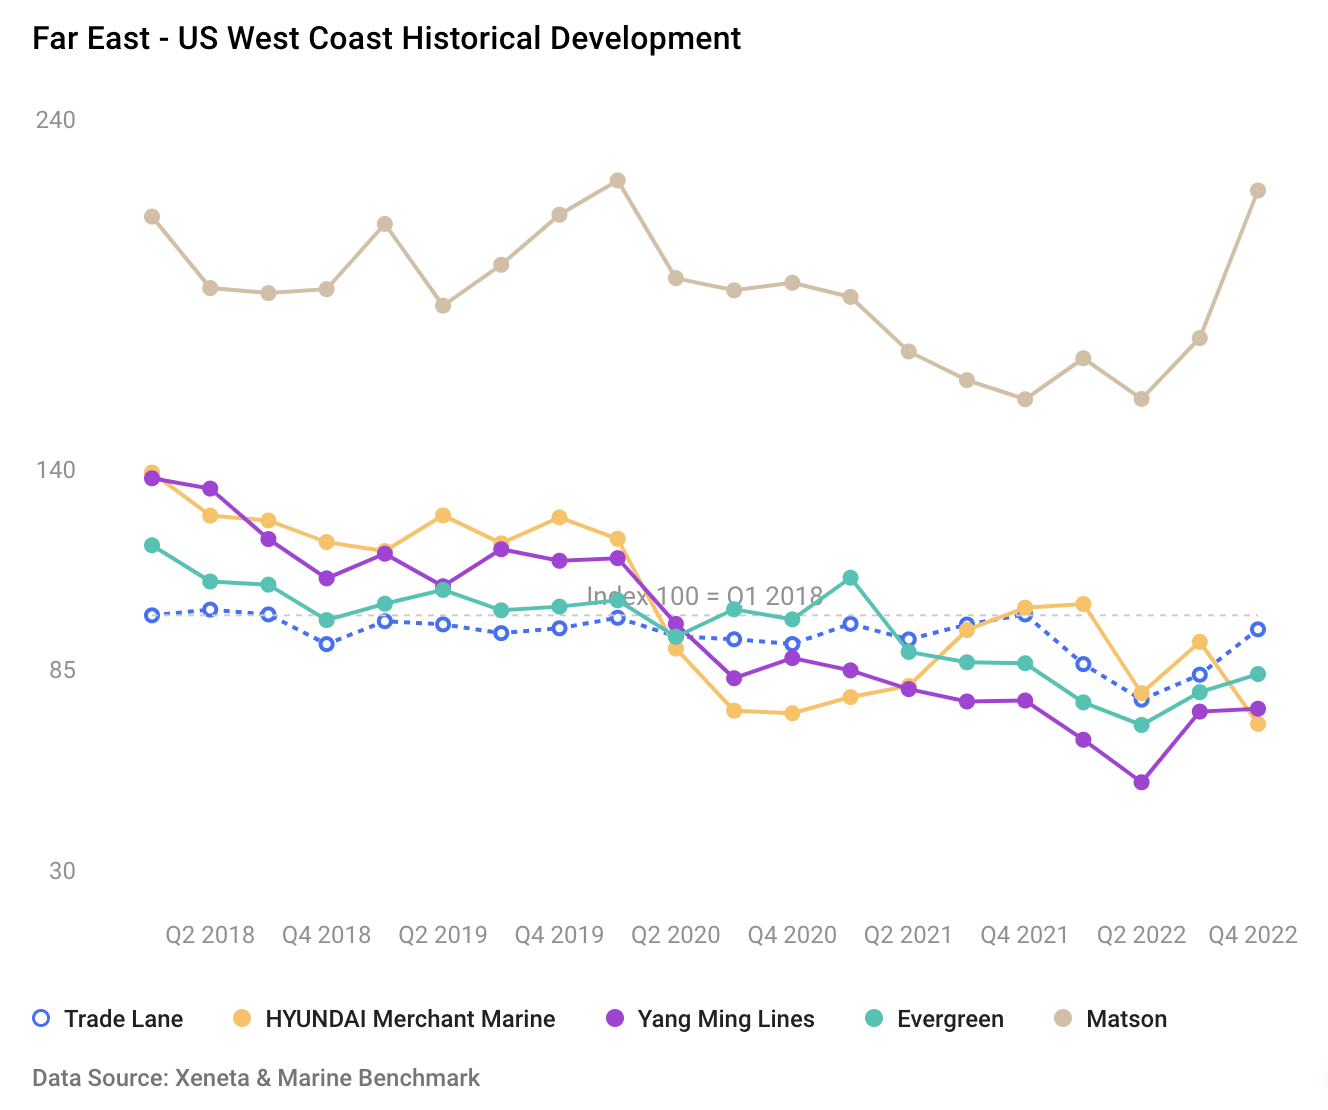
Q4'22 CEI Carrier Ranking
Far East to the US West Coast
|
RANKING |
CARRIER |
CEI SCORE |
| 1 | HYUNDAI Merchant Marine | 70.2 |
| 2 | Yang Ming Lines | 74.3 |
| 3 | Evergreen | 83.9 |
| 15 | Matson | 216.8 |
The CEI between the Far East to the US West Coast rose in Q4 2022, reaching its highest level of the year, but at 96.2, it remains below where it was in Q4 2021 (100.2).
Back then, the strong market conditions meant ships were speeding across the Pacific and getting stuck in congestion. The change in the queuing system to mitigate this congestion also led to ships sailing slower, thereby reducing CO2 emissions.
In Q4 2022, the average speed increased a little, despite the weaker market conditions. The CEI rose by almost 15% because of this higher sailing speed and because ships were sailing with less cargo on board in Q4 than in Q3.
The average filling factor fell to 76.5% in Q4 2022, its lowest level since Q1 2020, when lockdowns in China dented demand.
The best-performing carrier on this trade in Q4 2022 was HMM, scoring 27% better than the trade lane average.
This is the first quarter since Q3 2021 that HMM’s CEI is below the market average, let alone the best-performing carrier, but in Q4 2022, its filling factor was higher than the market average.
Get an honest view of carrier emissions
CEI data powered by Xeneta and Marine Benchmark makes no assumptions and is independent from carriers. It's sourced from AIS tracking of actual sailings, currently covering 13 of the world’s biggest trades, with more being added in the coming months. Find out how you can factor sustainability into your carrier selection and get a demo of the CEI here.

