Latest data reveals global ocean container shipping emitted all-time high carbon emissions in 2024, driven largely by the impact of conflict in the Red Sea.
The data, released by Xeneta and Marine Benchmark this week, is a timely reminder that, while the geo-political climate is heating up due to the US tariff announcements, we must not forget the actual climate emergency and the work that needs to be done in supply chains to combat it.
With emissions heading in the wrong direction, it raises fundamental questions around whether the International Maritime Organization’s (IMO) target of net zero by or around 2050 is remotely achievable. Shippers must also understand the impact emissions regulations will have on their business and the role they can play in reducing carbon in supply chains.
Record-breaking emissions
Global container emissions increased 14% in 2024 to 240.6m , comfortably surpassing the previous record of 218.5m tons of carbon set in 2021.
To be clear, this record-breaking statistic should not be used as a stick to beat the maritime freight industry with because it is largely due to ships sailing longer distances around the Cape of Good Hope following the escalation of conflict in the Red Sea in December 2023.
A new record high is the inevitable outcome of these diversions, both in terms of the increase in transport work and the record-high demand of laden containers being moved in 2024 as shippers responded to the Red Sea crisis by frontloading imports. Overall transport work (a measurement of tons of cargo moved multiplied by nautical miles sailed) increased 18% in 2024.
Emissions on the agenda
The record-high emissions data is a timely reminder of the colossal task at hand following a meeting last week (7-11 April) of the International Maritime Organization’s (IMO) Marine Environment Protection Committee (MEPC) in London.
Agreement was reached during the meeting on specific reduction targets on fuel intensity in container shipping, as well as the financial penalties for non-compliance (more details are provided later in this blog).
Biggest increases coming from the biggest ships
Firstly, we must understand the detail behind the record-breaking emissions in 2024.
The biggest increases in carbon emissions came from the largest ships, with these also the ones to experience the biggest increases in transport work.
Emissions from ships between 14 500 and 20 000 TEU hit 24.2m tons in 2024. This is up 7.3m tons (+43%) compared to 2023.
Ships over 20 000 TEU also saw large increases, up 35% from 2023 to 19.6m tons.
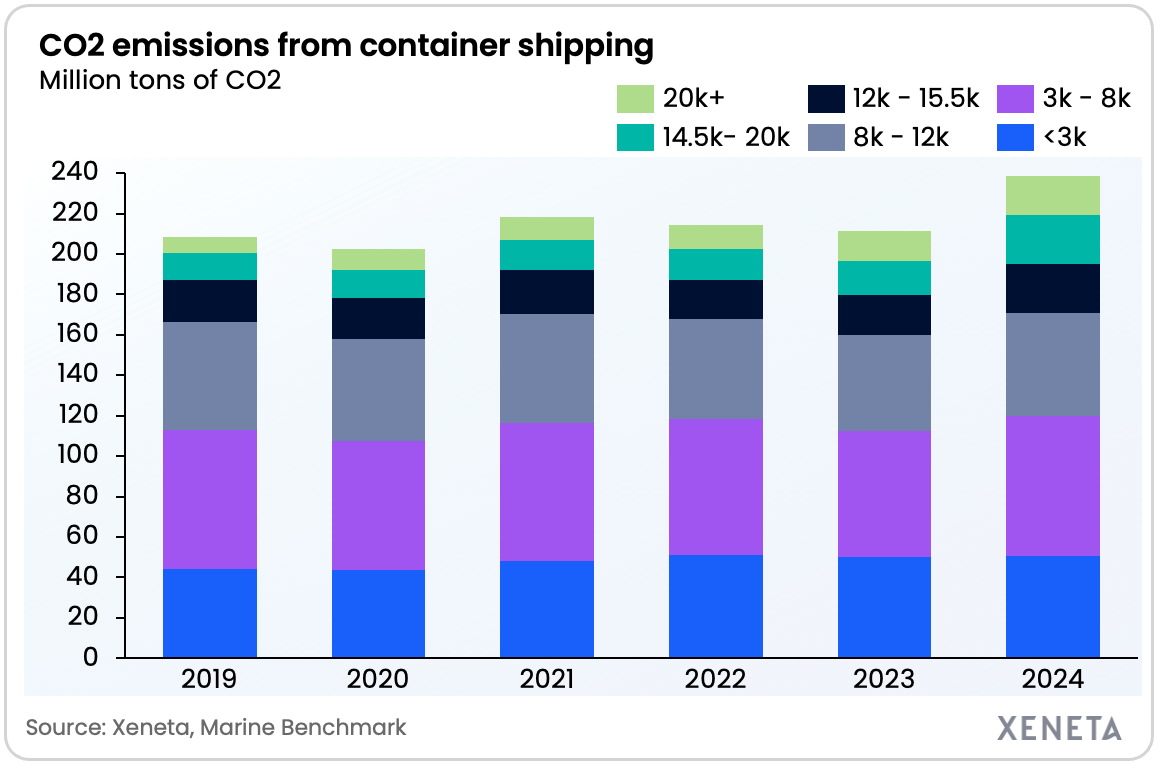
The two categories of ships over 14 500 TEU accounted for 18% of total CO2 emissions from the container shipping fleet in 2024, but this statistic is cast in a different light when we consider they make up 25% of total global capacity.
While ships over 14 500 TEU may have had the biggest year-on-year increases, they are perhaps not the main cause for concern.
That is because ships between 8 000 and 12 000 TEU have a much higher share of total emissions.
A higher base in 2023 means the 51.3 million tons of CO2 emitted by this category of ship in 2024 is only up 8% year-on-year. However, these ships account for more than fifth of total emissions despite only making up 20% of global container shipping capacity.
The disproportionate relationship between share of shipping capacity and share of emissions is explained by bigger ships tending to be newer and therefore much more carbon efficient.
Increase in transport work explains much of the emissions growth – but not all…
Across many ship sizes the increase in emissions in 2024 is within a few percentage points of the increase in transport work.
For example, ships between 14 500 and 20 000 TEU saw transport work increase 43%, in line with its growth in emissions.
This significant increase in transport work has in part been made possible by fleet growth of 26% between December 2023 and December 2024 for ships with capacity between 14 500 and 20 000 TEU.

There are however some exceptions where transport work growth and emissions growth aren’t aligned.
On the positive side, emissions increases for smaller size ships are lower than transport work. This is driven by improved efficiency through higher capacity utilization and stable (if not slightly decreasing) average sailing speed.
On a less positive note, the biggest ships over 20 000 TEU saw emissions increase 35% in 2024, more than double the 16.6% transport work growth.
That gap is explained by falling efficiency for these larger ships.
Firstly, sailing speed increased 5% in 2024, which adversely impacts fuel efficiency.
Secondly, the ships saw a drop in utilization, which is measured in tons of cargo carried multiplied by nautical miles sailed divided by TEU capacity in tons multiplied by nautical miles sailed. Or in more simple terms, how much cargo ships carried compared to how much they could have carried based on its capacity.
This utilization measure has fallen by almost 10 percentage points for the biggest ships compared to 2023.
The explanation is quite straightforward – total capacity offered by the largest ships in the fleet has increased, while at the same time, demand growth on key backhaul trades slowed.
This meant ships were even less full on these return legs than they were previously, which eats into a ship’s annual utilization.
Fronthaul volumes, measured in TEU, grew 9.5% in 2024, while demand on backhaul trades rose only 0.9%.
Regulation is coming
Turning attention back to the IMO agreement in London last week, a key standard in this new regulation will be the fuel intensity used by global shipping. This is measured on a well-to-wake basis (including the full life-cycle of the fuel).
Starting in 2028, ships must lower their fuel intensity by a certain percentage compared to the baseline set in 2008.
There are two tiers when it comes to the reduction factors:
- Tier 1 – the base target
Set at a 4% reduction in 2028. A ship will pay USD 380 for every ton of GHG emissions above the base reduction target. - Tier 2 – the compliance target
Set at 17% reduction in 2028. A ship falling between the base target and compliance target will pay USD 100 for every ton of GHG emissions or buy remedial units. Any ships outperforming the compliance target will earn surplus units, which can be banked for two years, or traded with non-compliant ships.
Reduction targets will increase every year, with expectations of a 65% reduction in carbon intensity by 2040. Plenty of details still need to fall into place, many of which should come in October 2025 when the agreement is expected to be finalized, and adopted.
While opinions on the deal are mixed, carriers now have more certainty on the path to decarbonization.
Carbon reduction strategy for shippers
We must be realistic when it comes to priorities right now. With the threats of US tariffs on every nation in the world and more than 100% from China, it will be difficult to get carbon emissions in supply chains onto the board meeting agenda at the moment.
However, while there are currently massive financial pressures for shippers, they can still include carbon reduction in their freight procurement strategy.
The chart below shows the spread in carbon emissions performance across top carriers on the trade from Far East to US West Coast.

The carriers are anonymized for this blog (Xeneta customers have visibility of Carbon Emissions Index data in the platform), but it is clear there is a significant spread in performance.
It is important to stress that lower emissions do not always equate to lower freight rates. While it is understandable shippers will be prioritizing the optimal rate during negotiations for their next contract, this does not mean they cannot also factor in carbon emissions, especially when they are choosing between two carriers with similar price and service delivery.
This data is also essential for those shippers looking to move more goods via ocean rather than the more expensive and more carbon intense air cargo.
- Click below to learn more on how Xeneta data can help your freight procurement strategy meet the challenges of the modern world, including the path to net zero.