


We are back with the latest edition of the Xeneta and Marine Benchmark Carbon Emission Index (CEI), and this week the focus turns to carriers’ Q3 performance on the US West Coast to the Far East trade.
HMM took the crown for best performer on this trade in Q3 with a score of 72.7 on the CEI.
Q3'23 CEI Carrier Ranking
US West Coast to the Far East
|
RANKING |
CARRIER |
CEI SCORE |
| 1 | HMM | 72.7 |
| 2 | CMA CGM | 75.3 |
| 3 | Yang Ming Lines | 88.6 |
| 12 | OOCL | 130.4 |
However, before we hail HMM’s Q3 emissions performance, a deeper dive into the data reveals it is perhaps not as praise-worthy as may first appear. That is because HMM’s score in Q3 was actually worse than Q2, jumping 17.4 points on the CEI to 72.7.
HMM are not alone in this regard, with third-placed Yang Ming Lines also recording an increase in the CEI in Q3.
There was good news elsewhere on the CEI with CMA CGM improving its score from 80.6 in Q2 to 76.3 in Q3 and securing second place on the index. When we look at the data, it is possible to identify reasons for the contrasting trajectories of CMA CGM and HMM on the CEI.
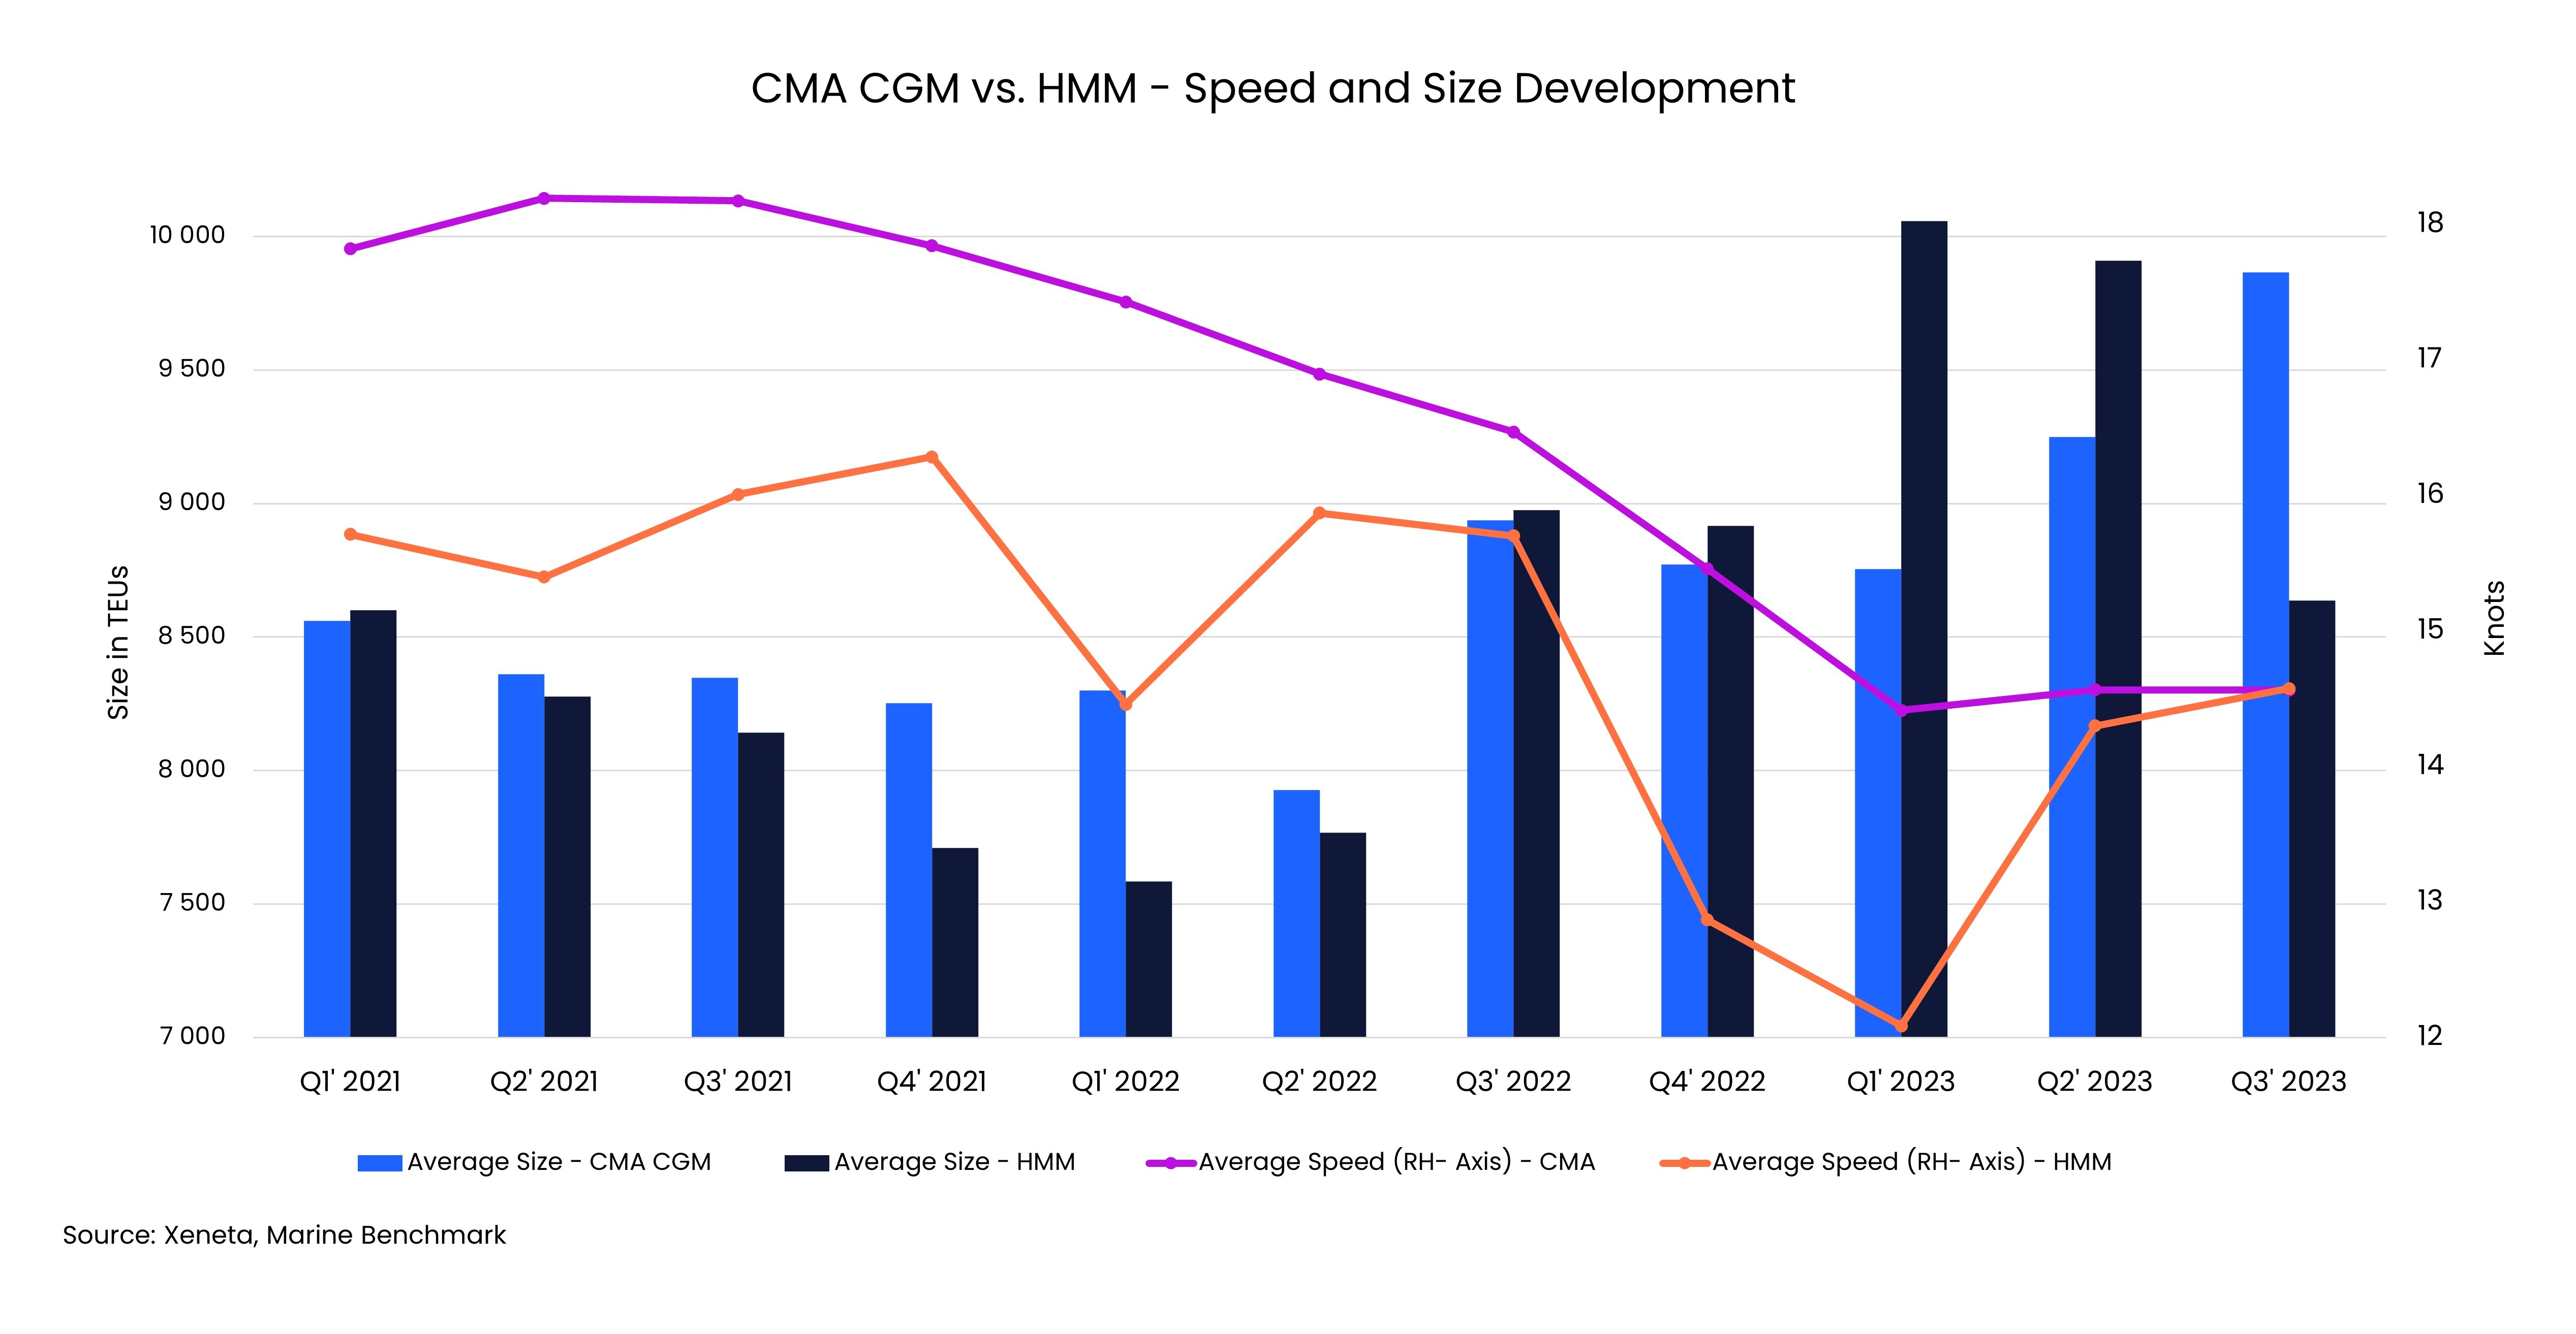
In Q1, HMM registered its all-time low average sailing speed on this trade at 12.1 knots. In Q2 this jumped to 14.3 knots before increasing even further in Q3 to 14.6 knots. Again, looking at average ship size, HMM set a record in Q1 at 10 059 TEU, but then this decreased to 8 637 TEU in Q3, which has a negative impact on CEI score.
In terms of both sailing speed and ship size, HMM’s performance has been heading in the wrong direction during 2023 – even if this carrier has recorded the best CEI for three quarters in a row.
In contrast, CMA CGM has seen sailing speed and average ship size heading in the opposite direction. During 2023, CMA CGM has registered sailing speed decreases in each quarter, albeit remaining within a tight range of 14.6 and 14.4 knots. Ship size has also increased quarterly, from 8 754 TEU in Q1 to 9 866 TEU in Q3.
Looking at the US West Coast to Far East trade as a whole, Q3 saw an increase of 10.5 points on the CEI compared to Q2, bringing the score up to 93.5. This can be attributed to a number of factors which negatively impact the carbon emitted per transported ton of cargo.
Firstly, the filling factor for this trade has decreased by 3.5 percentage points in Q3 to hit an all-time low of 56.5%. Secondly, the average ship size fell by 6% to 9 281 TEU. This comes after a Q2 which saw an all-time high average ship size on this trade of 9 878 TEU.
Finally, the average speed on this trade has increased from 14.4 knots in Q1 to 14.7 knots in Q2 and 15.2 knots in Q3.
Smaller ships with lower filling factor and travelling at higher speeds will mean only one thing – a worsening CEI score.
This trade lane is a backhaul with the decreasing ship size being a possible repercussion of carriers optimizing the more profitable fronthaul. This is potentially another example of how carbon emissions requirements are overpowered by market forces as carriers continue to battle overcapacity at a global level.
As we head towards 2024, the Xeneta CEI will provide a valuable insight on carriers’ carbon emissions performance and their success in balancing environmental responsibilities within a hugely challenging market.
Get an honest view of carrier emissions
Stay one step ahead of your competitors by making well-informed and sustainable choices when selecting shipping carriers. Xeneta and Marine Benchmark offer an independent and trustworthy Carbon Emissions Index (CEI) data, ensuring accuracy without any guesswork. By utilizing AIS tracking of real-time sailings on 48 major trade routes worldwide, with coverage expanding further in the near future, you can rely on up-to-date information. Don't settle for outdated and unreliable data. Schedule a demo of the CEI today and begin making intelligent shipping decisions.

