


We are back with the latest edition of the Xeneta and Marine Benchmark Carbon Emission Index (CEI), focusing on North Europe to the US East Coast trade.
The CEI on this trade during Q3 provides an intriguing insight – not only in terms of carriers’ carbon emissions performance, but also the impact of attempts to manage over-capacity of supply on a global scale.
Q3'23 CEI Carrier Ranking
North Europe to US East Coast
|
RANKING |
CARRIER |
CEI SCORE |
| 1 | Evergreen | 57.3 |
| 2 | COSCO | 68.5 |
| 3 | CMA CGM | 81.7 |
| 12 | MSC | 103.3 |
Let’s take a step back and consider the factors that are impacting the CEI on this trade. Firstly, we know carriers have been slow-steaming throughout 2023 to absorb capacity. The average speed between North Europe and US East Coast fell to 14.9 knots – the first time it has fallen below 15 knots since CEI records began in Q1 2018.
Continued slow-steaming will not come as surprise to observers of the ocean freight shipping industry, and it has contributed to the CEI for North Europe to US East Coast falling from 90.3 in Q2 this year to 83.2 in Q3.
Filling factor plummets
However, the most intriguing part of this CEI story lies in the filling factor of vessels on this trade rather than the slow-steaming.
In fact, filling factor has nose-dived on this trade to 69.1% in Q3 – a drop of almost 20 percentage points compared to Q3 2022.
For context, the average filling factor on this trade has not climbed above 71% in any of the three quarters in 2023. During 2022, the filling factor never fell below 79.7%.
An explanation for the declining filling factor can be found in the changing profile of vessels carriers are deploying on this trade.
Put simply, the North Europe to US East Coast trade is paying the price for carriers protecting profitability on other trades such as the Far East to US West Coast.
Carriers have seemingly chosen North Europe to US East Coast as a parking lot for ships they have removed from other major trades in an attempt to reduce supply and increase rates.
These ships have not been deployed on the North Europe to US East Coast trade to meet demand, quite the opposite. The demand is not there, so it is inevitable that the filling factor will suffer dramatically.
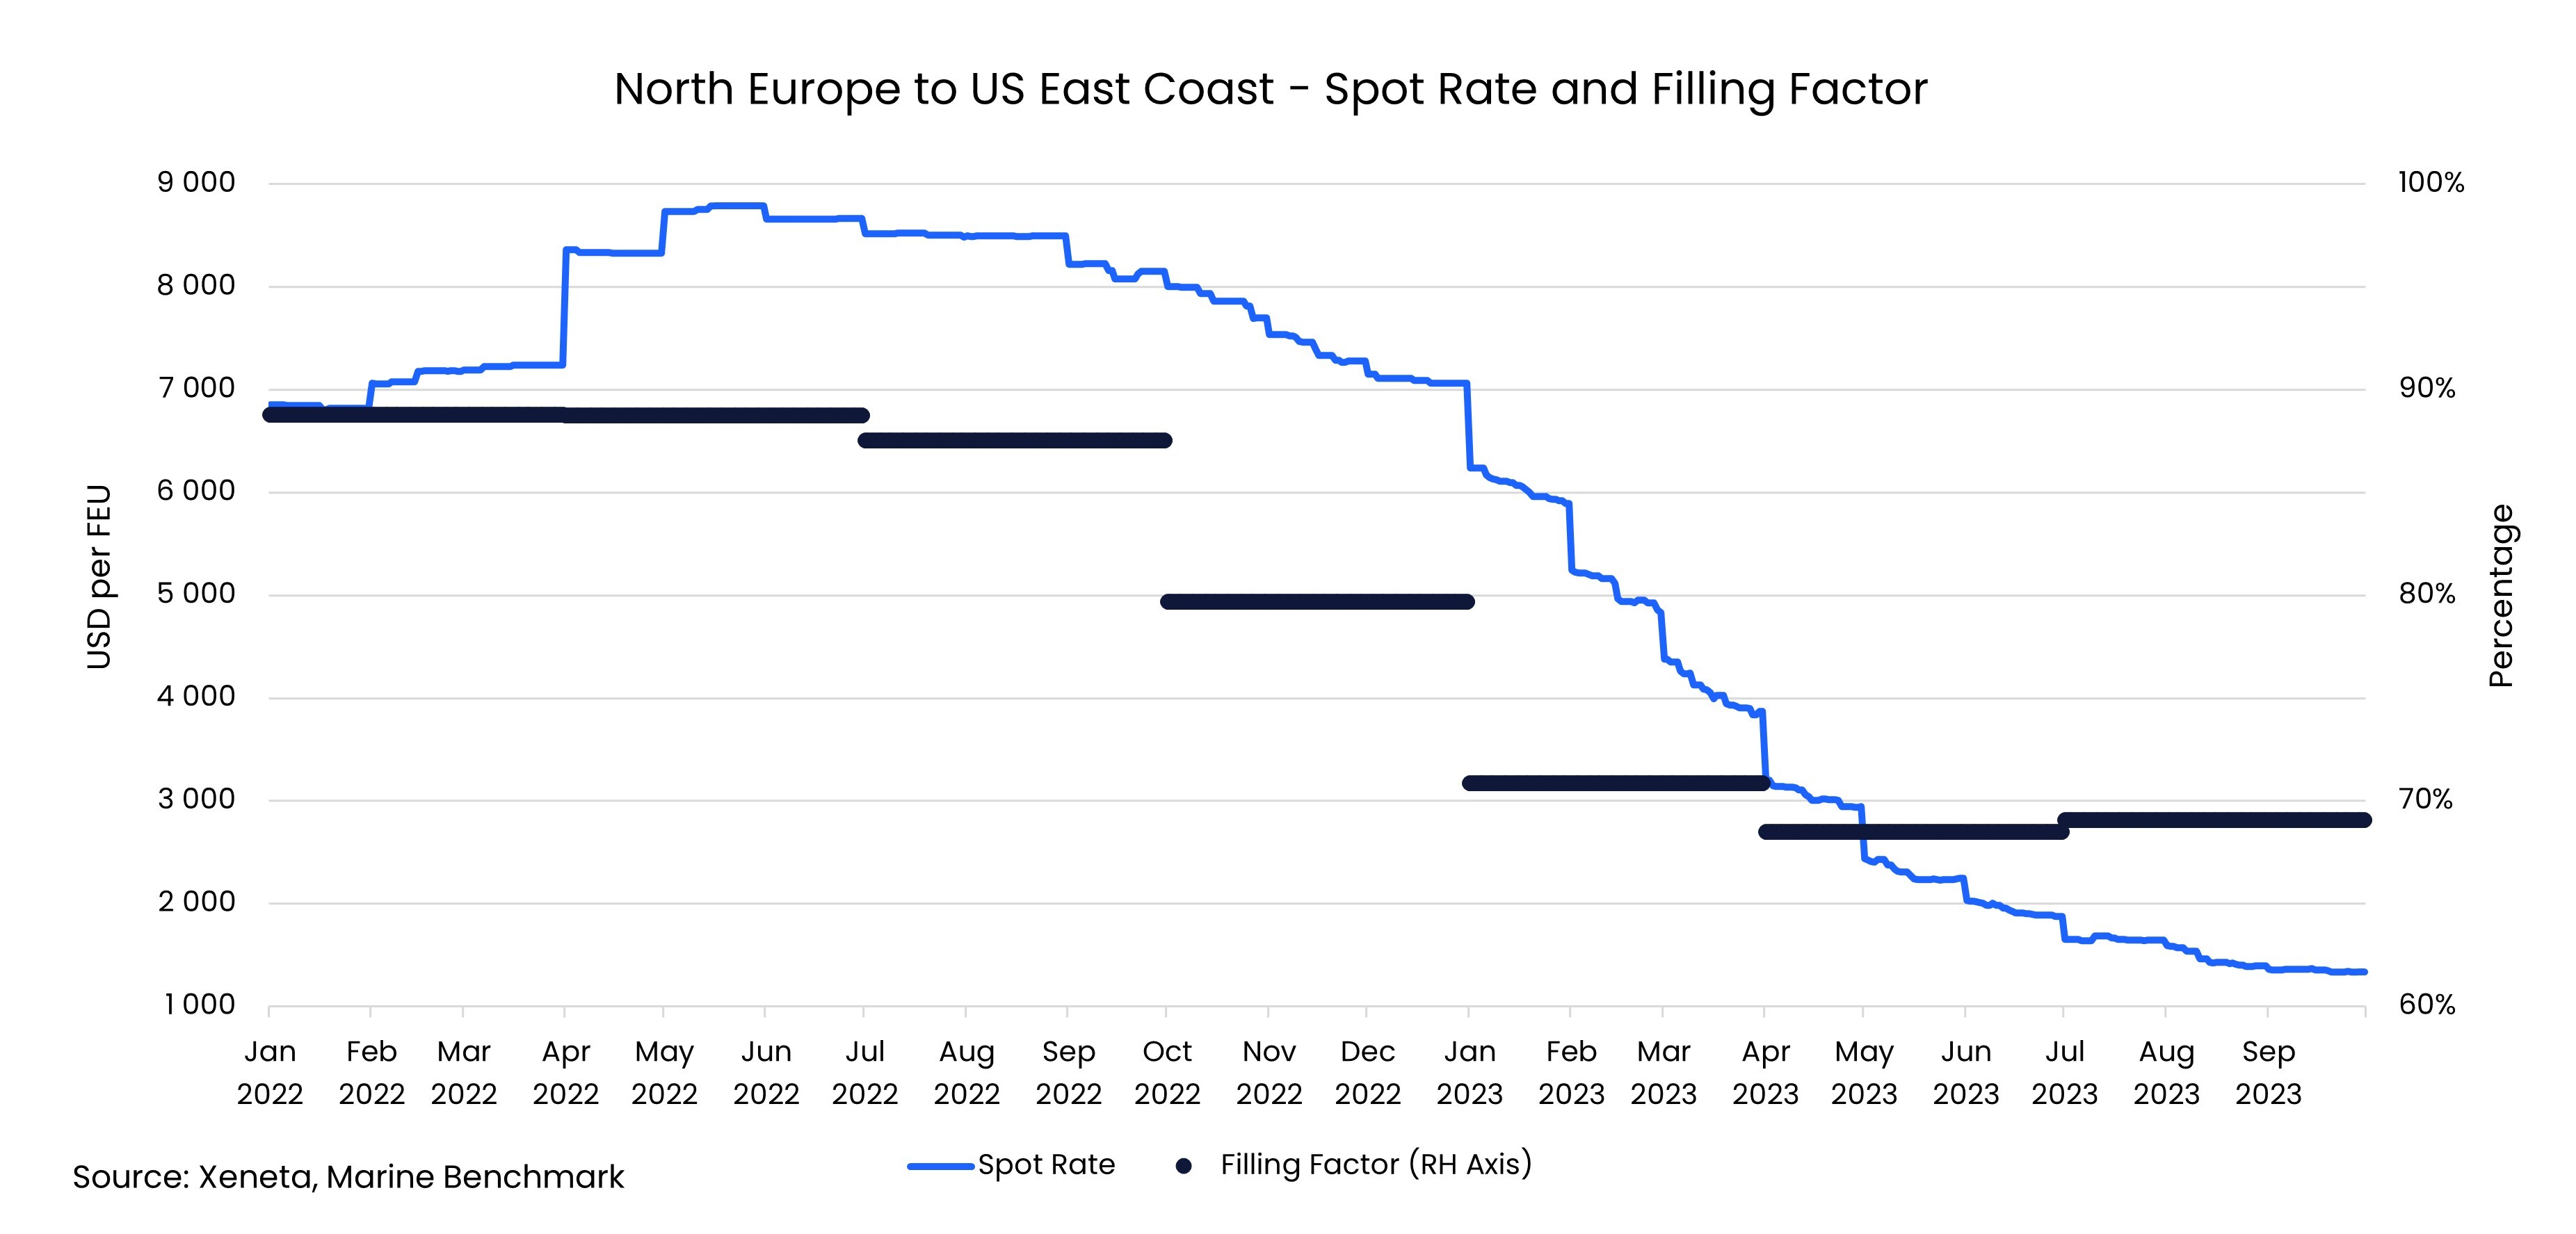
Freight rates hit record low
Not only has the filling factor plummeted on this trade, but freight rates have fallen to the lowest level ever recorded by Xeneta. In early November, the average spot rate between North Europe and the US East Coast stood at just USD 1 300 per FEU.
The question now is how long carriers will continue to sacrifice profitability on this trade. And when the time comes that carriers decide enough is enough, what impact will that have on the CEI rating, particularly at a time when IMO and ETS EU carbon emissions regulations are ramping up?
Evergreen tops the CEI ranking
In Q3 2023 the most carbon-efficient carrier on the North Europe to US East Coast trade is Evergreen.
With a score of 57.3, Evergreen beat the CEI average for this trade by 26 index points.
As we have highlighted in this latest CEI report, it is important to consider the fleet each carrier deploys on each trade. Evergreen’s fleet has decreased quarter-on-quarter in Q3 by 6.5%, lowering the average ship size on this trade to 12 772 TEU.
However, the decrease in Q3 should be viewed in the context of a big increase in the average size of ship deployed earlier this year. Compared to a year ago Evergreen’s ships on this trade are 34.9% higher.
Despite a decrease in ship size in Q3, Evergreen still has one of the largest fleets on this trade and is only surpassed by COSCO in this respect. The average size of vessels across all carriers on this trade is 5 400 TEU.
Younger fleet and slower-steaming key to CEI ranking
To understand how Evergreen has been able to top the CEI while also having a larger than average ship size we must look at the age of its fleet and sailing speed.
The ships Evergreen deploy may be bigger, but they are also younger. In Q3. Evergreen’s fleet averaged 4.4 years – considerably lower than the average across all carriers on this trade of 13.7 years. This is one of the highest average fleet ages across Xeneta’s top 13 trades globally.
Even the carriers in second and third place in the CEI - COSCO and CMA CGM - both deploy ships with an average age of over 10 years.
Another key factor in Evergreen taking first place in the CEI is its low sailing speed.
During Q3, Evergreen’s average sailing speed was 14.4 knots, with only MSC ships registering a slower speed. In comparison, Hapag-Lloyd’s fleet had the highest average speed on this trade, clocking 15.4 knots.
We can see that managing capacity – and profitability – is a delicate balance for carriers and their approach has a big impact on their carbon emissions performance.
This balance is only going to get more difficult, so Xeneta CEI will provide a valuable insight on carriers’ carbon emissions performance.
Get an honest view of carrier emissions
Stay one step ahead of your competitors by making well-informed and sustainable choices when selecting shipping carriers. Xeneta and Marine Benchmark offer an independent and trustworthy Carbon Emissions Index (CEI) data, ensuring accuracy without any guesswork. By utilizing AIS tracking of real-time sailings on 48 major trade routes worldwide, with coverage expanding further in the near future, you can rely on up-to-date information. Don't settle for outdated and unreliable data. Schedule a demo of the CEI today and begin making intelligent shipping decisions.

