


Backhaul trades can prove problematic for carriers attempting to balance carbon emissions requirements with the need to protect profitability on the fronthaul.
If it comes to a straight choice between carbon reduction and managing profitability at a global level within a hugely challenging market, how much can carriers afford to care about climate change?
Q3'23 CEI Carrier Ranking
North Europe to Far East
|
RANKING |
CARRIER |
CEI SCORE |
| 1 | CMA CGM | 94.6 |
| 2 | Maersk | 95.8 |
| 3 | ONE | 97.7 |
| 10 | Hapag-Lloyd | 128.9 |
To better understand this challenge, our latest Xeneta and Marine Benchmark Carbon Emissions Index (CEI) update is focusing on the world’s largest backhaul trade from North Europe to the Far East.
The CEI ranks carriers by their carbon emissions, with lower scores representing better performance in this regard.
A familiar story of declining CEI performance
The best performer on the CEI for this trade in Q3 was CMA CGM with a score of 94.6. Even though CMA CGM took top spot, Q3 represents a decline compared to Q2 and the third consecutive quarter in which performance has deteriorated. This reflects a global increase on the CEI across trades in Q3.
CEI scores are impacted by the average size and age of ships deployed on the lane combined with filling factor and sailing speed. For CMA CGM, the average age of ships decreased to 5.7 years in Q3 while the average size of ships increased by 4% to 20 184 TEU – both of which reflect positively on the CEI.
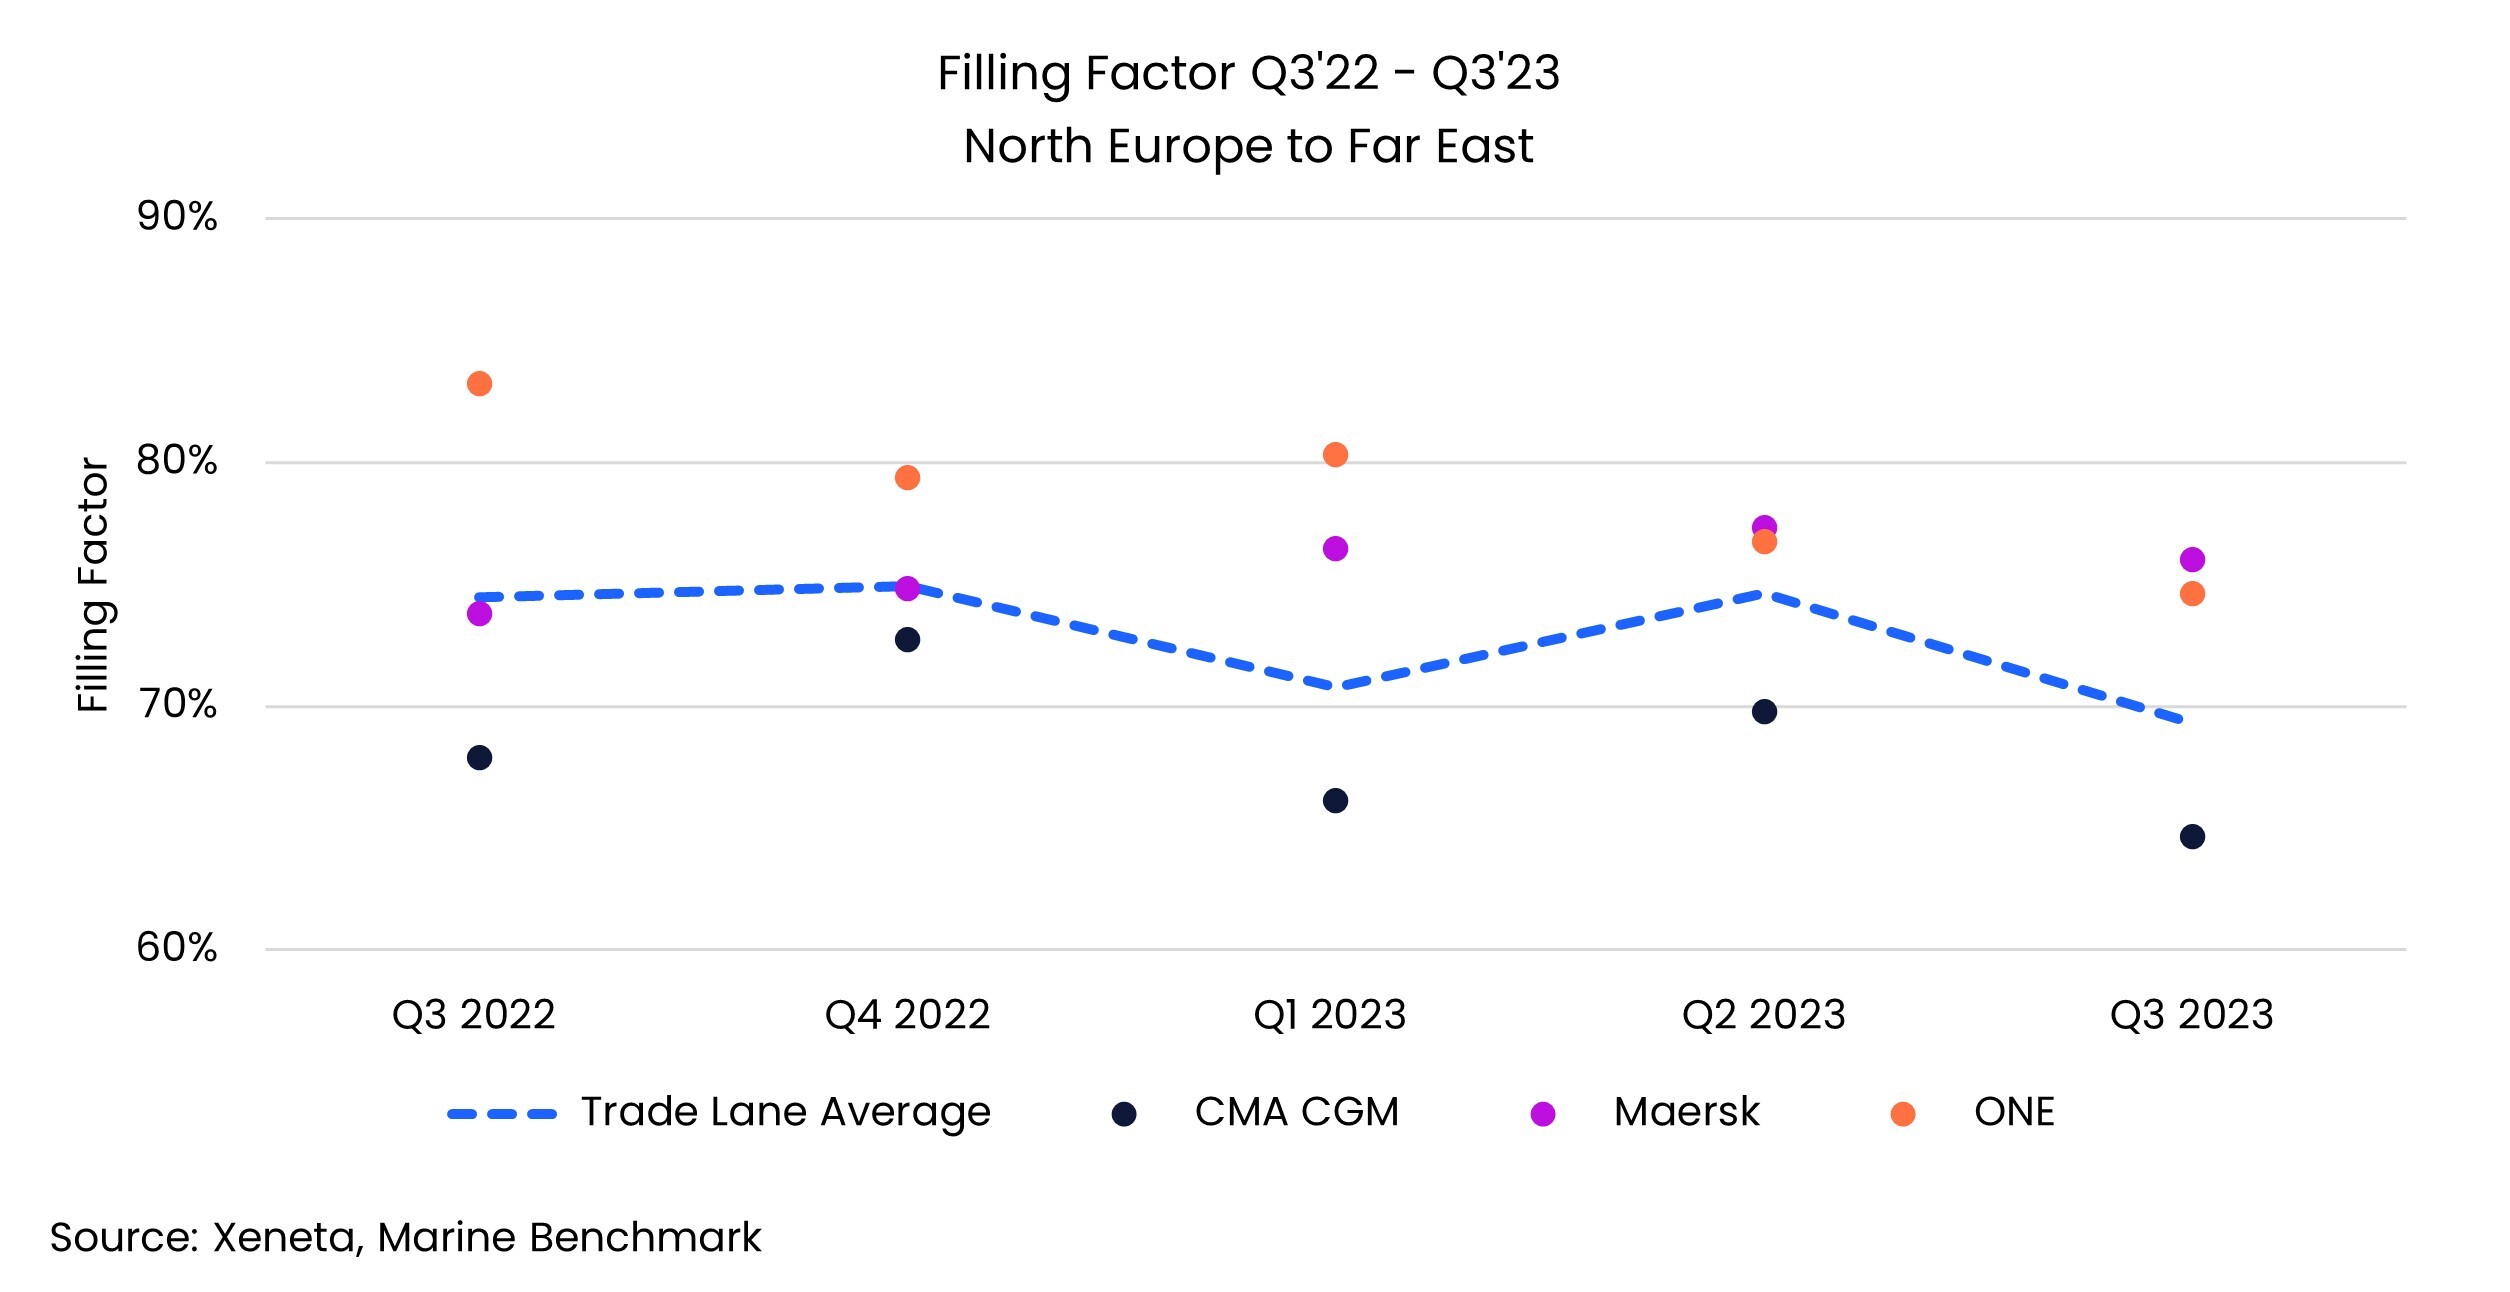
CMA CGM’s CEI score was adversely impacted by filling factor, which hit an all-time low for the carrier at 64.7% in Q3. This follows two consecutive quarters of declining filling factor and it will be interesting to see how CMA CGM react in Q4.
CMA CGM’s CEI score was also negatively impacted by average sailing speed which now stands at 14.9 knots, marking an increase of 2 knots since Q1.
How did CMA CGM beat Maersk and ONE to top the CEI?
How can CMA CGM take top spot on the CEI with a record-low filling factor and increasing sailing speed? This is all the more puzzling when both Maersk and ONE, who make up the top three on the CEI, registered filling factors in Q2 above 70%, albeit both have declined from Q2.
The answer lies in the average age of ships deployed on this trade. CMA CGM’s average age of 5.7 years is less than the ships deployed by Maersk and ONE by 3.5 years and 4.6 years respectively and beats the trade lane average by 0.9 years.
Trade sees overall increase on the CEI
The combined efforts of all carriers between North Europe and the Far East saw an overall CEI score of 101.8 on this backhaul trade, an increase of 6.2 points from Q2.
Q3 also saw the lowest overall filling factor ever recorded on this trade at a meagre 69.3%, while average speed across all carriers increased by 0.3 knots.
There was some good news however, with the average age of all ships deployed on this trade decreasing to an all-time low of 6.6 years.
Carriers may be eyeing profits, not carbon emissions.
Overall, it is clear that CEI performance on this backhaul is declining and it may be that carriers’ eyes are focused on protecting and optimizing financial performance on the fronthaul.
This notion of carrier prioritization is supported through data which shows CEI performance on the fronthaul has improved from a baseline of 100 when the CEI was launched in 2018 to 86.3 in Q3. Meanwhile performance on the backhaul has deteriorated from the 2018 baseline to 101.8 in Q3.
At Xeneta, we have been running a weekly series on how ‘No Two Trades Are Alike’, and this theme is equally true on the CEI as it is when looking at freight rates.
We only have to look at Hapag-Lloyd who are propping up the CEI on the North Europe to Far East backhaul with a CEI score of 128.9. When we compare this score to last week’s CEI update on the Far East to South America East Coast where Hapag-Lloyd claimed top spot with a score of 75, it becomes clear that carbon emissions performance is a highly complex and evolving situation on a global level.
This is a situation whereby one of the world’s largest and most powerful ocean freight liner companies has improved its CEI performance on one trade by 25 points against the 2018 benchmark, yet on another trade has seen performance worsen by 28.9 points.
In-depth analysis on carbon emissions regulations and performance
The landscape looks set to become even more complex in 2024 – particularly for trades involving Europe with the introduction of EU ETS regulations. If you have not yet read Xeneta’s in-depth analysis of these new carbon emissions regulations you can find it here.
As we head towards 2024, Xeneta’s CEI will keep providing valuable insights into carriers' carbon emissions performance and their success in balancing climate change-related responsibilities within a hugely challenging market.
Xeneta will continue to provide the most comprehensive insights on the industry’s drive towards climate sustainability so keep checking back for our CEI updates and expert insights.
Get an honest view of carrier emissions
Stay one step ahead of your competitors by making well-informed and sustainable choices when selecting shipping carriers. Xeneta and Marine Benchmark offer an independent and trustworthy Carbon Emissions Index (CEI) data, ensuring accuracy without any guesswork. By utilizing AIS tracking of real-time sailings on 48 major trade routes worldwide, with coverage expanding further in the near future, you can rely on up-to-date information. Don't settle for outdated and unreliable data. Schedule a demo of the CEI today and begin making intelligent shipping decisions.

