


The latest installment of the Xeneta and Marine Benchmark Carbon Emission Index (CEI) will focus on the Far East to US East Coast trade lane.
This lane was identified as one of the big movers on the CEI in our recent Q2 round-up with CO2 emissions falling by 23.3% since Q1 2018.
Has that trend continued in Q3 and, if so, which carrier is leading the way in reducing carbon emissions?
Q3'23 CEI Carrier Ranking
Far East to US East Coast
|
RANKING |
CARRIER |
CEI SCORE |
| 1 | Evergreen | 68.0 |
| 2 | Yang Ming Lines | 70.0 |
| 3 | COSCO | 71.4 |
| 12 | MSC | 105.6 |
The scores are in…
Taiwanese carrier, Evergreen, takes the title of top performer on the fronthaul trade lanes from the Far East to the US East Coast.
Evergreen’s Q3 CEI rating of 68.0 outperformed the lane's average score by 9.6 index points.
Indeed, Evergreen are on a roll with their carbon-emission reductions, with the latest data confirming Q3 as the third quarter in a row in which it has improved its CEI score.
The last time Evergreen had a worsening CEI score was back in Q4 2022 when it registered 76.5 and languished in fourth place in the ranking.
Since then, OCEAN Alliance’s Evergreen has performed quite a turnaround, leapfrogging carriers Yang Ming Lines, ONE and Hapag-Lloyd (all part of THE alliance) into first place on the Xeneta CEI.
Slower speeds powering emissions success
Age of ships and speed of sailing both have a significant impact on CEI ratings. While all four major carriers named above deployed older ships in Q3 when compared to the end of 2022, Evergreen is the only one which also reduced sailing speed during this time period.
At first glance it may seem peculiar that, while Evergreen has reduced its sailing speed since Q4 2022, it remains the fastest of the named carriers. In Q4 2022 it sailed at 3 knots faster than its closest rivals on the CEI, while in Q4 2023 this reduced to 0.7 knots.
Evergreen’s historic tendency for faster sailing speeds has actually helped its CEI scores because it has left greater room for improvement. Simply being on par with the trade lane average speed is a carbon emission reduction success when you are coming down from a lofty starting position.
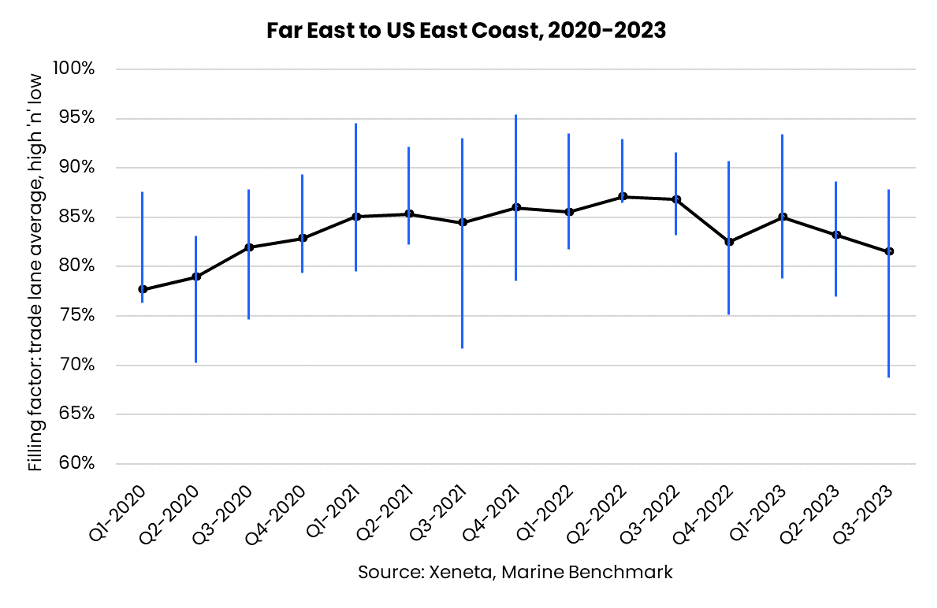
Equally important, Evergreen is the only one of the Top 4 carriers who can boast a higher filling factor in Q3 2023 when compared to Q4 2022. Evergreen’s filling factor of 85.9% is now second only to Zim Lines’ stellar filling factor of 87.8%.
Bigger is often greener… but not always
Size does matter, as anyone who works with supply chains and global container shipping knows.
However, the size of your ship isn’t the be-all and end-all of carbon emissions performance. For example, whereas Evergreen’s average ship size is exactly 10% larger than the trade lane average, it is also 10.7% smaller than the average loaders operated by Yang Ming Lines.
Yang Ming Lines operates specifically on Far East to US East Coast trade lane via Suez Canal, with ships marginally above 14,000 TEU.
It is clear that bigger ships will not achieve emissions reductions in isolation, with considerations such as filling factor and sailing speed all coming into play on the CEI.
Trade suffers a CEI setback in Q3
The success or otherwise of carbon emission reductions on this trade very much depends on your frame of reference.
With an overall CEI score of 77.6 in Q3 2023, the Far East to US East Coast trade fairs well in comparison to Q1 2018 when CO2 per ton of cargo transported was 22.4% higher.
But when we consider the story in the first half of 2023 was continuous CEI improvements, a 1 point increase from the 76.6 recorded in Q2 can only viewed as a setback.
The increased CEI score in Q3 can be attributed to lower filling factors on this trade, which could not be offset even with slower sailing speeds.
Bigger ships are too much for the trade to handle
The average age of ships deployed on this trade increased marginally in Q3, however the real story lies in the average size of these vessels, which increased by 2.6%.
Carriers are attempting to manage capacity on high-priority major trades by cascading larger ships onto less usual lanes, such as the Far East to US East Coast. It appears the cascading of larger vessels onto this lane is having a negative impact on CEI performance.
New regulations are on the way
The importance of Xeneta’s CEI is growing ever stronger following the introduction of the IMO’s Carbon Intensity Indicator (CII) regulations at the start of 2023 and the EU’s Emissions Trading Scheme (ETS) in January next year.
Understanding which carriers are performing best in terms of carbon intensity is set to become even more beneficial for shippers – especially when surcharges begin to be added for the purchase of emissions allowances.
Stay in the know with the help of Xeneta’s CEI as we follow how this new element of maritime decarbonization will influence the industry in the upcoming years.
Get an honest view of carrier emissions
Stay one step ahead of your competitors by making well-informed and sustainable choices when selecting shipping carriers. Xeneta and Marine Benchmark offer an independent and trustworthy Carbon Emissions Index (CEI) data, ensuring accuracy without any guesswork. By utilizing AIS tracking of real-time sailings on 48 major trade routes worldwide, with coverage expanding further in the near future, you can rely on up-to-date information. Don't settle for outdated and unreliable data. Schedule a demo of the CEI today and begin making intelligent shipping decisions.

