


The Xeneta and Marine Benchmark Carbon Emissions Index (CEI) turns its focus to the Far East to South American East Coast trade where performance appears to be heading in the wrong direction.
The CEI ranks carriers by their carbon emissions, with lower scores representing better performance in this regard.
Q3'23 CEI Carrier Ranking
Far East – South America East Coast
|
RANKING |
CARRIER |
CEI SCORE |
| 1 | Hapag-Lloyd | 75.0 |
| 2 | Yang Ming Lines | 75.8 |
| 3 | Wan Hai Lines | 76.3 |
| 12 | HMM | 111.6 |
In Q3, Hapag-Lloyd took first place on the CEI with a score of 75 points, which is 15.6 points lower than the average on this lane, but this belies an underlying decline in performance.
Hapag-Lloyd in first place despite worsening performance.
While it was still good enough to take top spot, Hapag-Lloyd’s Q3 score does not compare favorably to their Q2 tally of 72.2. Hapag-Lloyd are not alone in seeing their score worsen in Q3, with Yang Ming Lines taking second place with a score of 75.8, compared to 71.7 in Q2.
Wan Hai Lines took third place and was the only carrier in the top three to register an improvement in Q3, down from 80.6 to 76.3.
It should be pointed out that, while there may be contrasting trajectories within the top three, they all still occupy a similar score on the index.
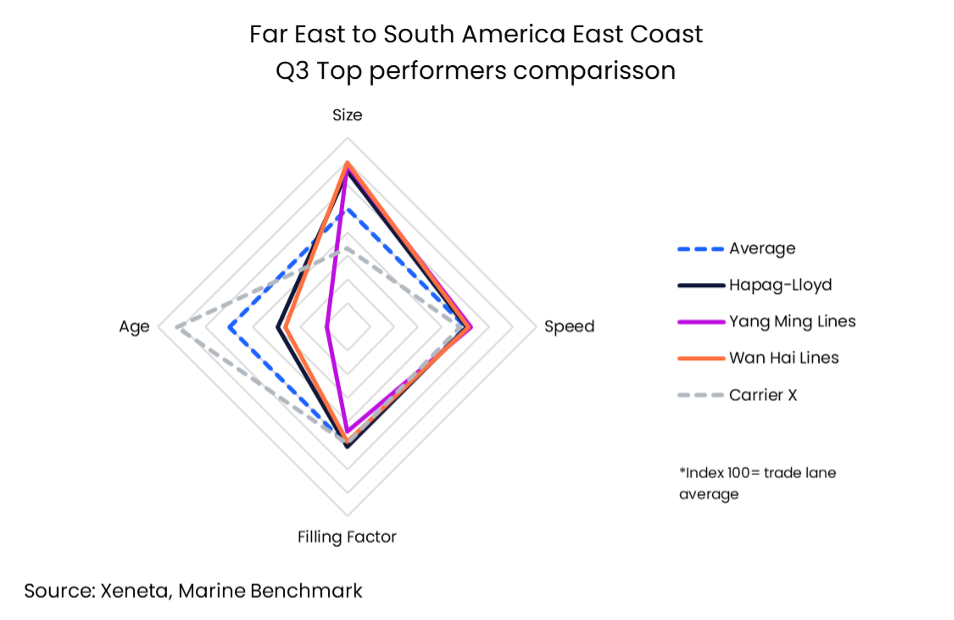
A mixed bag across vessel size, sailing speed and filling factor.
To understand a carrier’s performance on the CEI we must look at the factors impacting it – namely ship size, sailing speed and filling factor.
When it comes to size, Wan Hai Lines had the biggest average vessel capacity of 11,923. But all top three carriers have larger vessels than the average on this trade, with Hapag-Lloyd deploying an average of 11 314 TEU and Yang Ming Lines with an average of 11 714 TEU.
When it comes to sailing speed, it is a similar story with the top three carriers coming in above the average of 16.1 knots on this lane. Hapag-Lloyd registered 16.3 knots while Yang Ming Lines came in at 16.9 knots and Wan Hai Lines at 16.5 knots.
In terms of the CEI, faster sailing speeds equates to a higher (or worse) score.
When we look at filling factor, only Hapag-Lloyd’s 93.9% bettered the trade average AMONGST THE TOP 3 CARRIERS, but only by 1.1 percentage points.
Different strategies, but a similar CEI score
The top three carriers may have similar overall CEI scores in Q3, but they achieved them in different ways. For example, Yang Ming Lines had a far inferior filling factor compared to Hapag-Lloyd, but they compensated for this on the CEI through the age of their ships, which was 8.3 years below the average for this lane. It was also half the average age of ships operated by Hapag-Lloyd and Wan Hai Lines, which results in a more efficient service in terms of carbon emissions.
Worsening picture across the trade
There has been a weakening in performance across the whole trade lane, with the average CEI increasing from 85.4 in Q2 to 90.6 in Q3. Factors contributing towards this increase are a 0.3 knots increase in sailing speed and a 1.3% decrease in ship size.
Despite Yang Ming Lines deploying far younger ships than their competitors, the overall trade average age of vessels has steadily increased during 2023, from 9 years in Q1, to 9.4 in Q2 and 10 in Q3.
There was some positive news however through an improved average filling factor, which increased by 0.3 percentage points to 92.8% in Q3.
Carbon emissions is a key topic in the industry, particularly with the introduction of the EU ETS regulations in 2024. Keep a lookout for our upcoming in-depth report on these new regulations and the impact they could have on shippers and carriers, along with expert insight from our analysts Peter Sand and Emily Stausbøll.
We’ll also be back next week looking at a carriers’ carbon emissions performance on one of the world’s other major trades.
Get an honest view of carrier emissions
Stay one step ahead of your competitors by making well-informed and sustainable choices when selecting shipping carriers. Xeneta and Marine Benchmark offer an independent and trustworthy Carbon Emissions Index (CEI) data, ensuring accuracy without any guesswork. By utilizing AIS tracking of real-time sailings on 48 major trade routes worldwide, with coverage expanding further in the near future, you can rely on up-to-date information. Don't settle for outdated and unreliable data. Schedule a demo of the CEI today and begin making intelligent shipping decisions.

