


Presenting the latest edition of Xeneta and Marine Benchmark Carbon Emission Index (CEI). Our spotlight now turns to the Far East to South American East Coast trade route. As seen in Q1, Pacific International Lines (PIL) maintains its top position with a score of 69.5 points, outperforming the trade lane average by 19%.
Q2'23 CEI Carrier Ranking
Far East - S. America East Coast
|
RANKING |
CARRIER |
CEI SCORE |
| 1 | PIL | 69.5 |
| 2 | Yang Ming | 71.7 |
| 3 | Hapag-Lloyd | 72.2 |
| 12 | HMM | 99.2 |
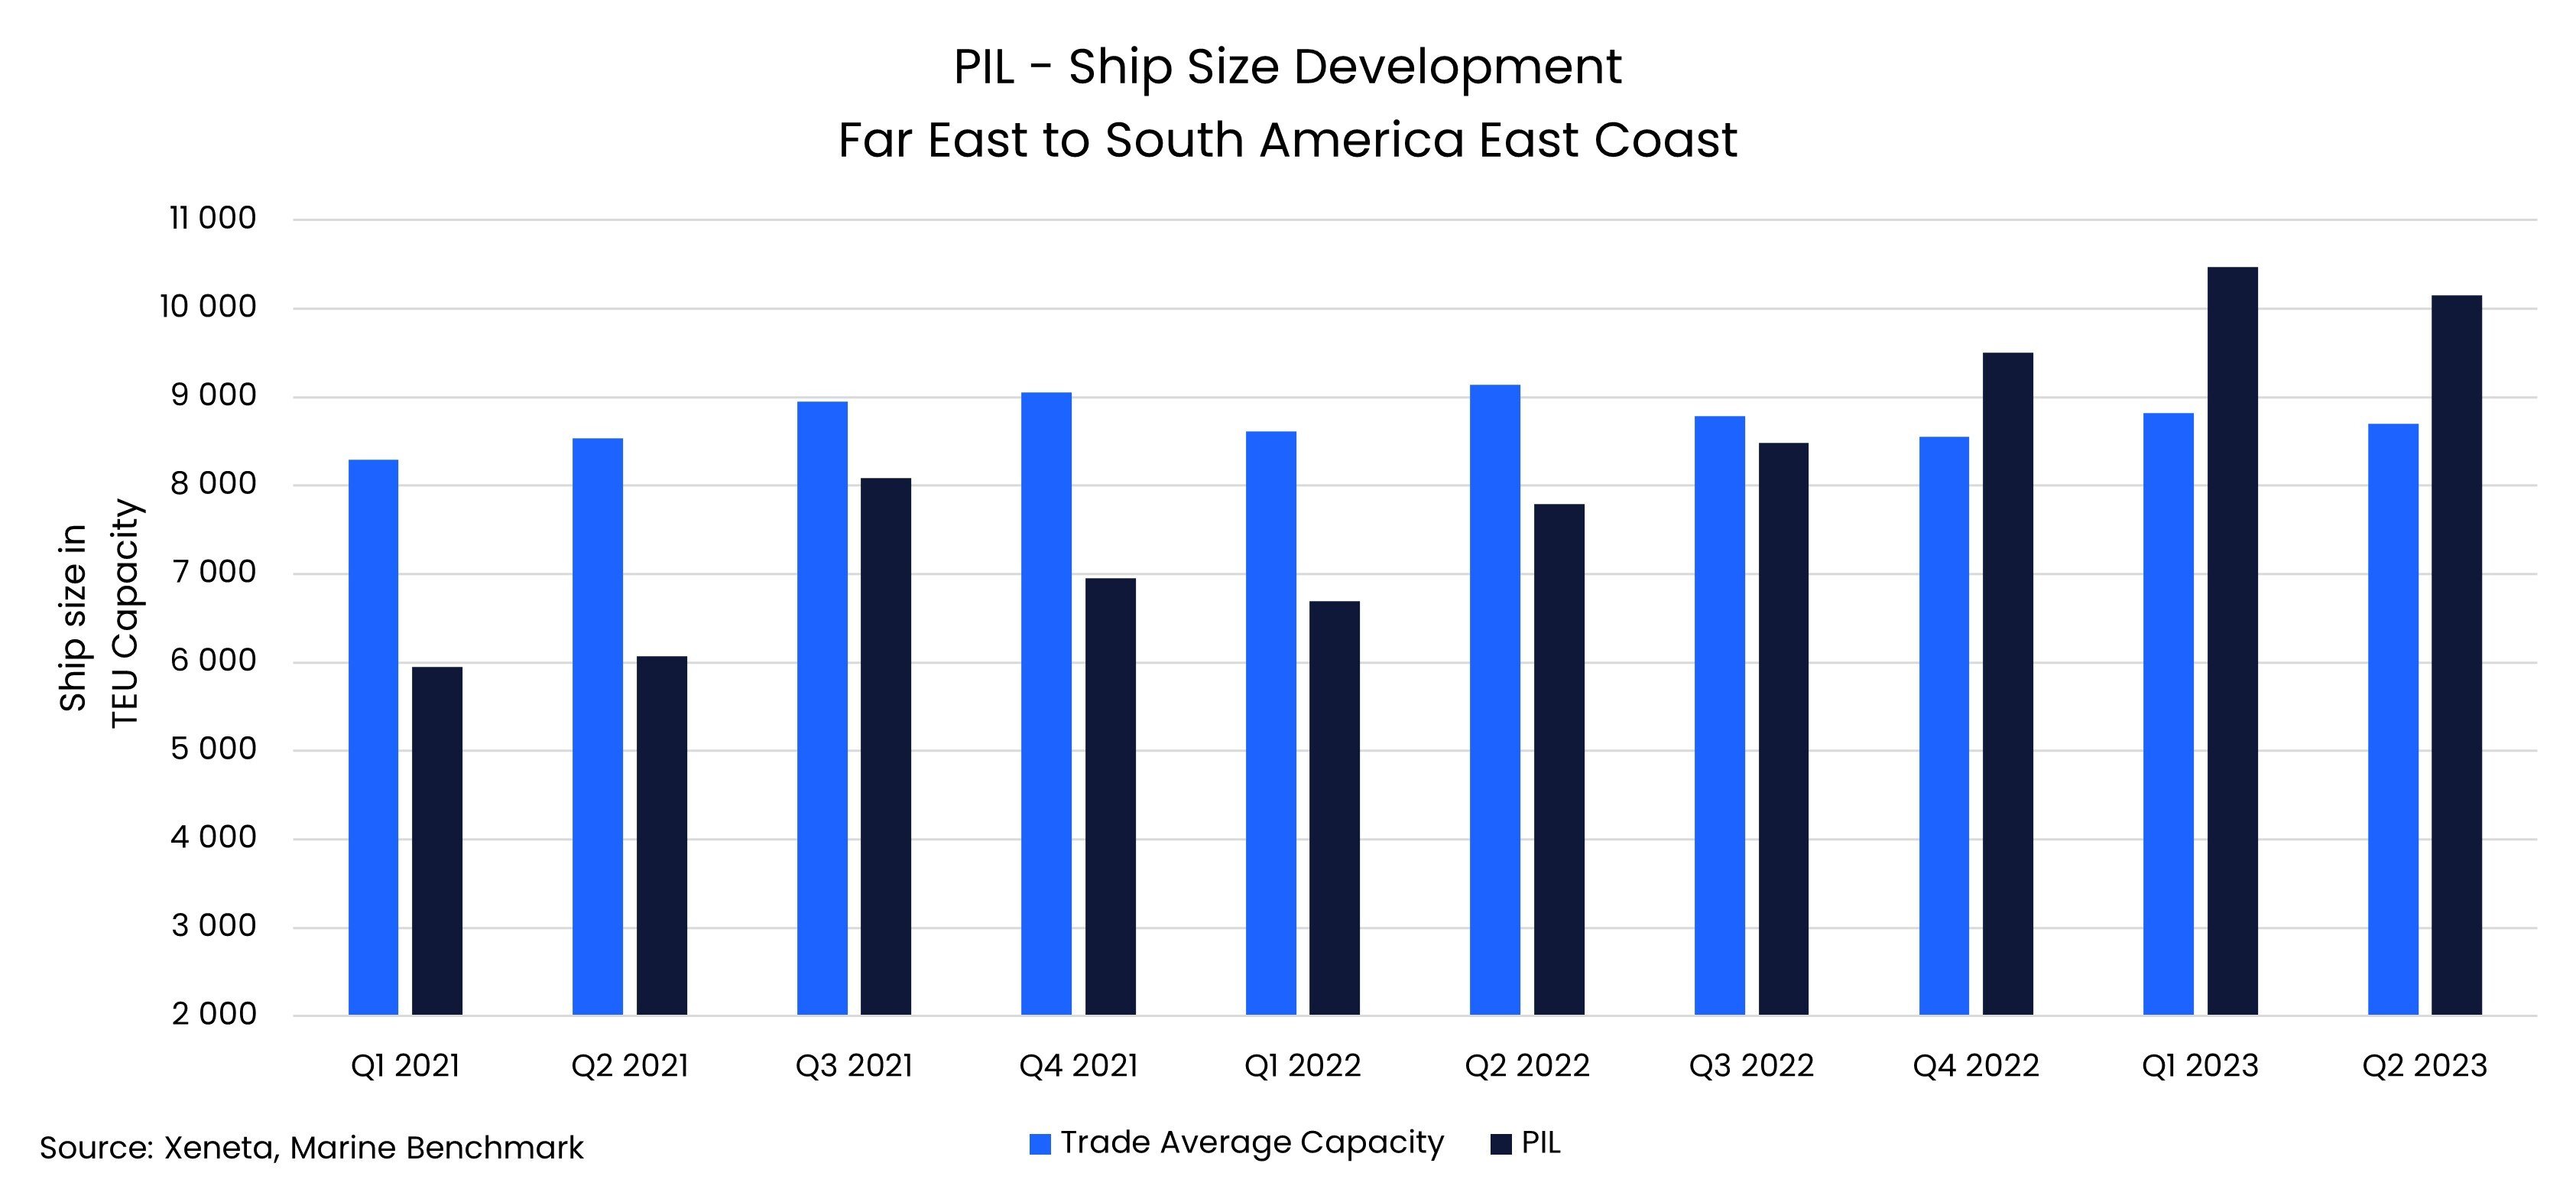
PIL's consistent success in the CEI index for this trade route over the past year continues into Q2'2023. This achievement can be attributed to several factors: slightly reduced speed (14.7 knots, 1.1 knots below the Q2 trade lane average), a comparatively younger vessel age (2.5 years less than the average), and a growing filling factor over the last three quarters. PIL has maintained a filling factor above 85% since Q3’2020, reaching 90% in Q2'2023 despite deploying bigger ships than the average on this trade lane.
Q2'2023 witnessed the highest recorded CEI performance for the Far East to South America East Coast route, reaching a notable 85.4 index points. This advancement can be attributed to a combination of factors. Firstly, both Q1'2023 and Q2'2023 reported the lowest average speeds on this trade lane, standing at 15.6 and 15.8 knots, respectively. Secondly, while the average ship size slightly decreased, the filling factor increased, indicating enhanced capacity management by the carriers.
Based on CTS data, there was a steady 21.6% year-on-year increase in volumes within this trade lane during Q2. This growth likely influenced the filling factor. Certain carriers chose smaller vessels, enhancing capacity utilization and subsequently their carbon footprint. Larger ships positively affect the carbon footprint when their additional capacity is effectively used, as demonstrated in this trade lane.
Keep an eye out for further insights into the elements driving carriers' eco-friendly efforts and the advantages they bring to supply chains. In the upcoming weeks, we will delve into additional significant trade routes and their roles in fostering a more sustainable maritime industry.
Get an honest view of carrier emissions
Stay one step ahead of your competitors by making well-informed and sustainable choices when selecting shipping carriers. Xeneta and Marine Benchmark offer an independent and trustworthy Carbon Emissions Index (CEI) data, ensuring accuracy without any guesswork. By utilizing AIS tracking of real-time sailings on 48 major trade routes worldwide, with coverage expanding further in the near future, you can rely on up-to-date information. Don't settle for outdated and unreliable data. Schedule a demo of the CEI today and begin making intelligent shipping decisions.

