


Conflict in the Red Sea has brought dramatic increases in carbon emissions across ocean freight shipping fleets.
Escalation in attacks by Houthi militia in December has seen the majority of ocean freight container ships avoiding the Suez Canal, meaning trades from the Far East to Europe and US East Coast are now being diverted around the Cape of Good Hope in Africa.
Not only has this caused widespread supply chain disruption and spiraling costs for ocean freight shipping, the longer sailing distances have resulted in huge increases in carbon emissions according to the latest data released today, Tuesday, on the Xeneta and Marine Benchmark Carbon Emissions Index (CEI).
The CEI is based on average CO2 emissions per ton of cargo carried, with the baseline set in Q1 2018. Any reading below 100 indicates an improvement in carbon efficiency over the past five years.
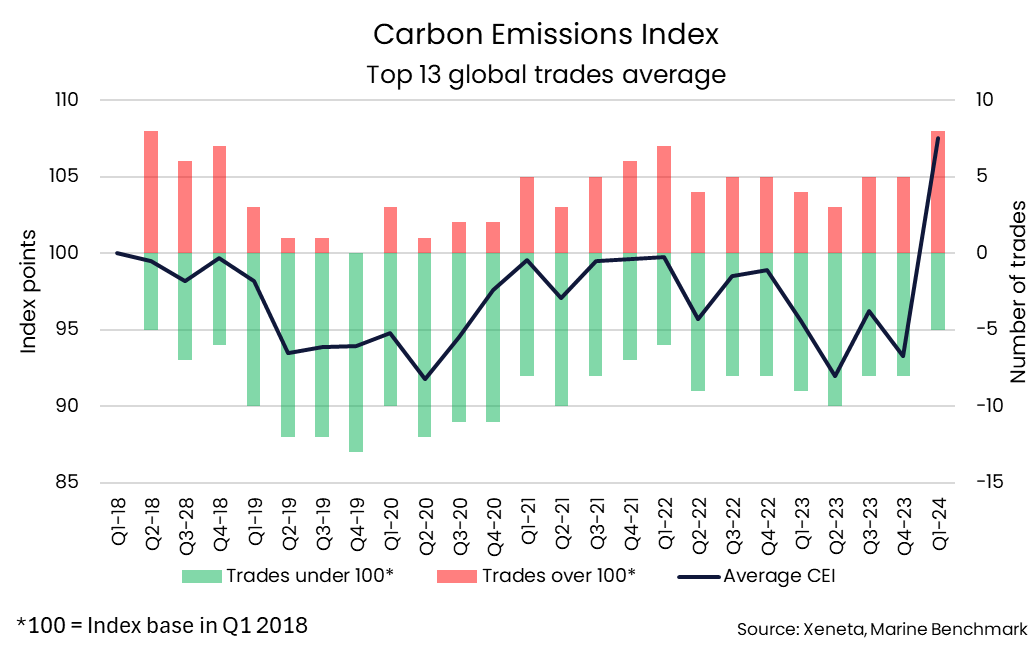
In Q1 2024, the period immediately following the outbreak of conflict in the Red Sea, the average CEI rating across the world’s top 13 ocean freight shipping trades hit 107.5 points. This is the first time the average CEI has been above 100 at a global level and marks a 15.2% increase from Q4 2023.
When comparing Q1 2024 against Q1 2018, only five of the top 13 trades emitted less CO2 per ton of cargo carried. This is three trades less than in Q4 2023 and the lowest in any quarter since Q2 2018.
When comparing against Q4 2023, 10 out of the top 13 trades saw average CO2 emitted per ton of cargo increase in Q1 2024.
The fact such a high number of trades have seen carbon emissions increase in Q1 2024 – even those that do not ordinarily transit the Suez Canal - demonstrates the global nature of supply chain disruption.
The two trades that posted a quarter-on-quarter improvement were the fronthaul trades from the Mediterranean and North Europe to the US East Coast as well as the backhaul from the US East Coast back to the Mediterranean.
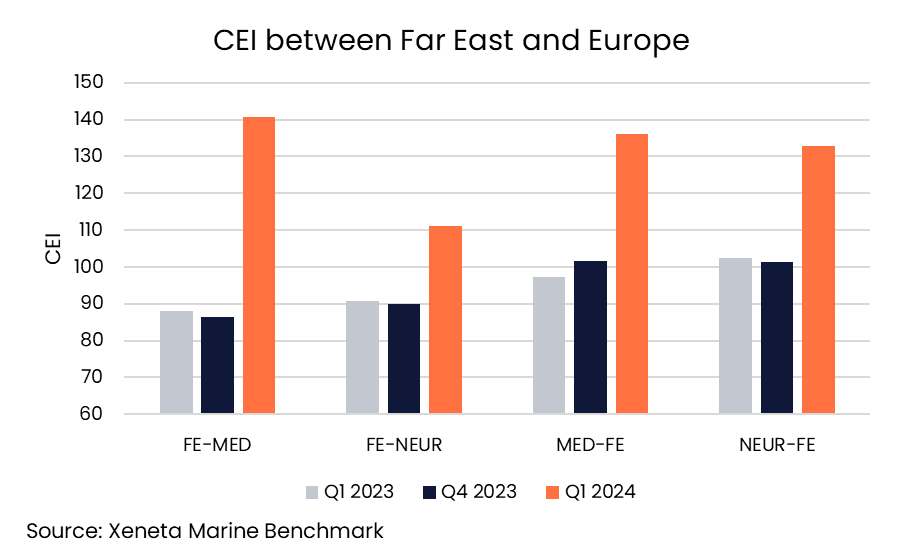
Biggest carbon impact found between Far East and Europe
Unsurprisingly, the trades with the biggest increases in CO2 emissions are those between the Far East and Europe, with the two fronthauls (Far East to Mediterranean and Far East to North Europe) and two backhauls (Mediterranean to Far East and North Europe to Far East) taking the top four spots in the CEI in terms of quarter-on-quarter increases.
The CEI index on the Far East to the Mediterranean trade registered the biggest rise, moving from 86.3 points in Q4 2023 to 140.8 points in Q1 2024 – an increase of 63.1%.
This means it has moved from being one of the best performing trades in terms of carbon emissions in Q4 2023 to now stand as the worst performing in Q1 2024.
Q1 2024 is also only the second time carbon emissions from the Far East to the Mediterranean are higher than they were in Q1 2018 and only the second time that any of the top 13 trades have averaged a CEI rating higher than 140.
The increase on the Far East to North Europe trade was smaller, up by 23.3% from Q4 2023, but its score of 111.0 points still represents a significant increase in carbon emissions per ton of cargo transported.
Bigger increases in the CEI have been recorded on the backhaul trades to the Far East from the Mediterranean and North Europe, up by 34.1% and 31.1% respectively.
Longer sailings mean more carbon emissions…
Naturally, the biggest reason for higher carbon emissions is the longer distance. Diversions around the Cape of Good Hope mean the average distance a container is transported via ocean on a global level is up by 11% compared to the start of 2023.
On the Far East to Mediterranean trade – arguably the most impacted in terms of the diversion around the Cape of Good Hope – the average sailing distance for a container has increased by 60.7% in Q1 2024 compared to Q4 2023.
In actual terms, this means a shipping container on this trade is now being transported 15 200 nautical miles on average compared to 9 400 nautical miles in Q4 2023.
Sailing distance is not the only factor driving carbon emissions
The diversions around the Cape of Good Hope have placed extra transportation demand on ocean freight services – so ships have had to speed up to try and mitigate the longer sailings - but burn more fuel in doing so.
The biggest increase on the CEI’s top 13 trades is found on the backhaul trade from the Mediterranean to the Far East, where average sailing speeds in Q1 2024 were up by 9.8% compared to the previous quarter.
Looking at a global level, average sailing speed reached 15.4 knots in January for container ships between 12 000 TEU and 17 000 TEU (source: Clarksons). This is the highest speed since June 2022 when Covid-19 disruption was still causing major disruption.
Although speeds have fallen slightly since January, the global average was still above 15 knots in mid-April, which will have a detrimental impact on carbon emissions performance.
This increasing sailing speed is not only found on trades directly impacted by the Red Sea diversions. In fact, only four of the top 13 CEI trades slowed down in Q1 compared to Q4.
The biggest quarter-on-quarter decrease in average sailing speed is found on the trade from the Mediterranean to US East Coast, which is down by 0.5 knots to 14.1 knots. This is the same speed as on the backhaul of this trade and lower than all the other top 13 trades.
The trade with the highest average sailing speed in Q1 2024 was the Far East to US West Coast, clocking in at 16.6 knots.
Older ships impact carbon performance
Sailing longer distances around the Cape of Good Hope requires more ships to maintain services schedules – and again this has resulted in a deterioration in carbon emissions performance.
Not only does this mean there are more ships burning more fuel, carriers have needed to bring in older, less efficient vessels to meet this additional demand.
For example, between the Far East and the Mediterranean, the average age of ships deployed has increased by one year to 7.4 years in Q1 2024 compared to Q4 2023.
Not only are these ships older – they are also smaller, meaning they are less efficient in terms of average CO2 emissions per ton of cargo carried. On the Far East to Mediterranean trade, the average size of ships deployed decreased by 5.1% in Q1 2024 to 15 160 TEU.
Higher filling factor improves CEI performance
One consequence of the diversions which has helped to counteract increasing emissions on most major trades has been filling factor – the amount of cargo carried versus capacity.
Only one of the top 13 trades saw a slight dip in filling factor, which was the backhaul trade from the US West Coast to Far East.
Increasing utilization was observed on the other major trades, with two recording their highest filling factor since the CEI began.
Firstly, on the Far East to North Europe trade, filling factor increased by 6.1 percentage points. This is one of the reasons why this trade registered a smaller increase in its CEI score compared to the trade from the Far East to Mediterranean, despite both being heavily impacted by Red Sea diversions.
The other trade to register a new record filling factor is the Far East to the US West Coast where a 1.0 percentage point increase nudged it past its previous highest level.
This improved filling factor is largely due to increasing demand, with 1.7m TEU shipped from the Far East to US West Coast in the first two months of 2024 – up by 26.7% compared to the same period in 2023.
Global re-alignment of capacity
However, despite strong year-on-year growth, these volumes in January and February 2024 are still lower than the final two months of 2023 before supply chains were gripped by disruption due to conflict in the Red Sea.
Increasing utilization on trades such as the Transpacific which do not transit the Suez Canal must therefore also be attributed to a tightening of available capacity.
Why would this be the case? Because carriers are removing ships from these trades and redeploying them on trades which are most impacted by the Red Sea diversions in an effort to maintain service schedules.
The impact of war on carbon emissions
With a semblance of normality now returning to ocean freight container supply chains, as demonstrated by the softening in the average spot rate market, it remains to be seen whether this will also see an improvement in carbon emissions performance in Q2 2024.
Certainly, even if we see an improvement in Q2 from Q1, if ships are continuing to sail longer distances around the Cape of Good Hope, then it is almost inevitable that the CEI performance will be worse when compared against 2023 levels.
Regardless, the deterioration in the CEI in Q1 2024 demonstrates the severe and immediate impact conflict has on supply chain carbon emissions.
Carbon emissions in supply chain procurement
With conflict and major global incidents such as Covid-19, Ever Given and drought in the Panama Canal becoming a seemingly more regular occurrence in recent years, measuring impact on supply chain carbon emissions becomes a more pressing requirement.
Xeneta customers are utilizing the CEI data to understand carbon emissions across the individual trades in their supply chains. This data also allows them to analyze CEI performance at a carrier level, meaning they can select their ocean freight service provider based on carbon emissions as well as cost and reliability.
More information on carrier CEI performance will be included in the next Xeneta Weekly Rate Update.


.png?width=387&name=freight-ship-reliability%20(1).png)
