


With contract negotiations now on their way or coming to a conclusion for Asia-Europe and negotiations for North American companies soon beginning, recent headlines have made it clear that the market is still unpredictable for a number of reasons. It should come as no surprise that the megas entering the market, the new alliances which have already started and the avalanche of empty boxes could threaten the tenuous ocean freight rate gains of the past six months.
Guided by Thomas Sørbø, Xeneta Co-founded & CBDO, we took a bird’s eye view at the Apr 2017 shipping rates in the Xeneta platform for the main global routes.
Webinar - April 2017 Shipping Prices at a Glance
- Presentation transcript: Read below (or download full transcript in PDF format)
- Live Q&A session: Read answers to common questions from the webinar
Presentation Transcript
[Thomas Sørbø]:
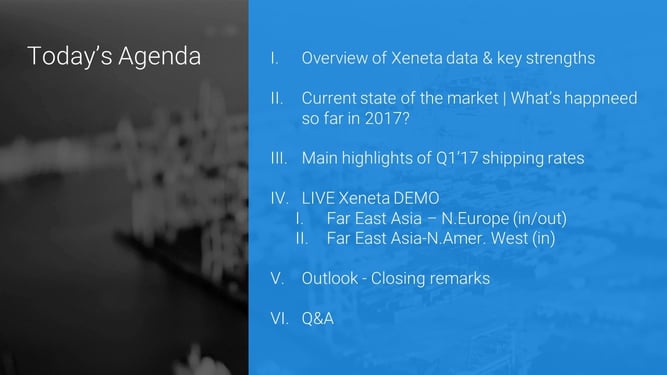
Today's Agenda
[01:16] We are going through turbulent times. A lot happening in the market. Spot market rates are almost back at the level of what they were approximately two years ago.
[01:31] Carriers have been able to force through large, high rate increases across the board. Shippers and also forwarders have huge challenges now in order to secure space, or get the outbound from Europe. The rates are increasing both on the import side, on the export side to and from ‑‑ quite a lot of the different continent combinations.
[01:59] There's a lot of challenges in terms of some of the companies when it comes to finalizing the tenders. What is a good rate level? Are we able then, to secure long‑term rates, and so forth? Also, obviously, to set the right expectations internally.
[02:14] Today we're going to go through this agenda. First of all, I'm going to give a quick overview about our company. Then, I'm going to show you a bit when it comes to the current state of the market. Also, now, some of the highlights in Q1.
[02:33] I'm going to show you a live demonstration of the platform and to end it off with some outlooks, what we see from the data that we have on hand. The last five minutes will be for a Q&A session where you're welcome to ask any questions. We'll do our best to answer them.
[03:02] If we don't have enough time to answer them we will come back by email.
Xeneta | A Brief Introduction
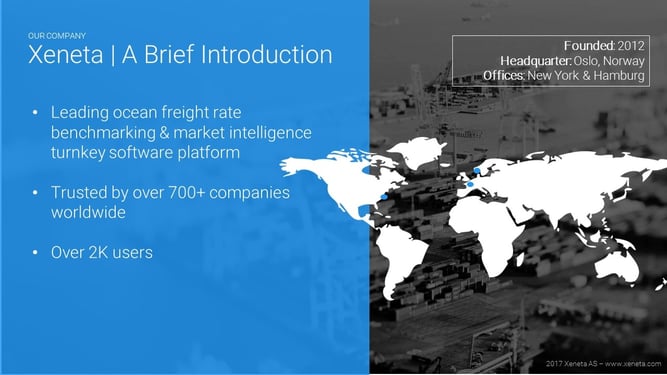
[03:10] Xeneta is a market intelligence platform. We provide market intelligence for shipper, freight forwarders, and carriers. We are a neutral platform that crowdsource freight rates from our customers. Today we work with more than 700 customers all around the world with more 2,000 users.
[03:33] We're headquartered in Oslo in Norway. That's also why you can hear my accent. We also have an office in Hamburg and also one in New York to be closer to our customers.
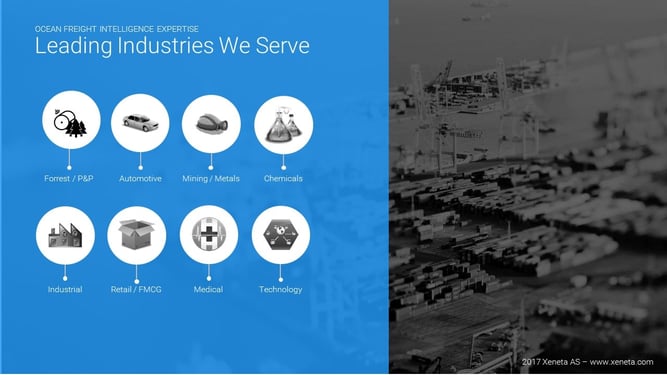
[03:46] We work with all kinds of industries. What they have in common is that they ship a lot of containers. Usually, also, that they have a complex supply chain, meaning that they're shipping products to and from all kinds of continents all over the world.
[04:02] This is truly unique with Xeneta. In Xeneta, we focus on only the dry land container market, so only 20‑, 40‑, and 40‑foots high cubes. We provide analysis and intelligence when it comes to that.
[04:19] Since 2012, when we started the company we have been able to attract large shippers from all over the world because more or less everyone has the same questions. How competitive are we in today's market? At least from a shipper's point of view. From a forwarder's point of view, how competitive are the rate that we receive from the carriers? In terms of also to stay competitive when selling to shippers.
[04:49] Aso when it comes to carriers it's very interesting to see what kind of rate levels are being offered into the market to try to optimize rate levels. In Xeneta, we work with all industry stakeholders.
World’s Largest Database of Contracted Ocean Freight Rates
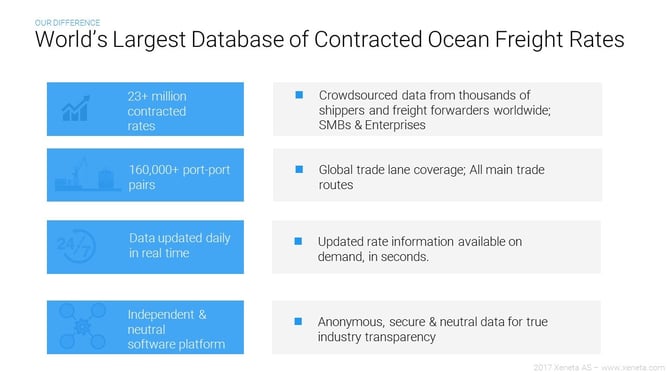
[05:01] We are the largest database when it comes to contracted ocean freight rates. Today we have more than 23 million contracted rates crowdsourced into our platform. Obviously, container freight benchmarking and market intelligence will never get better than the information that we will base it on.
[05:31] All this information from these 700 clients makes it possible for us to cover more than 160,000 port-port combinations all over the world. What also differentiates us from anyone else is that we update our information real time. It's updated every day based on the input we get from customers. That doesn't mean that if you're a shipper with a long‑term contract, over a year, that you'll have to update that on a daily basis.
[06:02] It means that based on the duration of the contract we will import that into the application. Since companies are negotiating on different times during the year, some have long‑term contracts, others have short‑term contracts, we'll use those validity dates to calculate the indexes.
[06:20] Last but not least, an extremely important point ‑‑ we are independent. None of our shareholders come from the industry. It's extremely important for Xeneta to remain neutral because we want to do business with everybody. We truly believe that transparency can help both shippers, forwarders, and carriers.
Xeneta Data
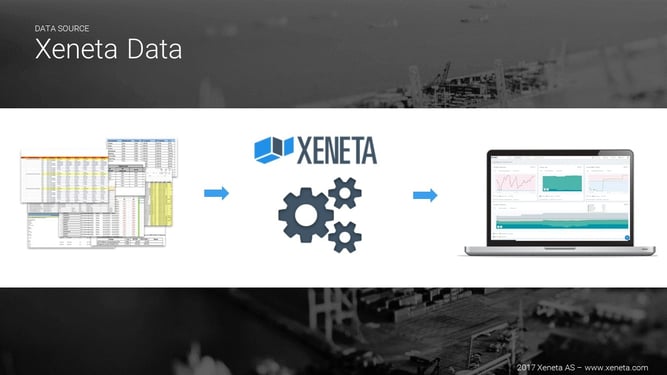
[06:45] How do we get data? What do we mean by data? As you all know and are familiar with how the shipping industry utilizes Excel. The input to Xeneta is usually the output from a tender from a shipper or larger rate sheets that we receive from our forwarders. The information those sheets include are obviously the duration of the contract, the equipment types, the surcharges, the base rates, and so forth.
[07:22] What we do with our rate management team here in Oslo is that we normalize and structure that data into a comparable format. Based on that, we create indexes and dashboards that help our customers measure their performance over time, understand how they compare to the market, to set the right expectations internally, but also to drive negotiations with either a forwarder or a carrier. And then, also to track that development over time.
[07:54] Since logistics and since shipping is such a volatile and opaque market, you need tools to optimize and improve performance.
Container Shipping | A Slumping Market
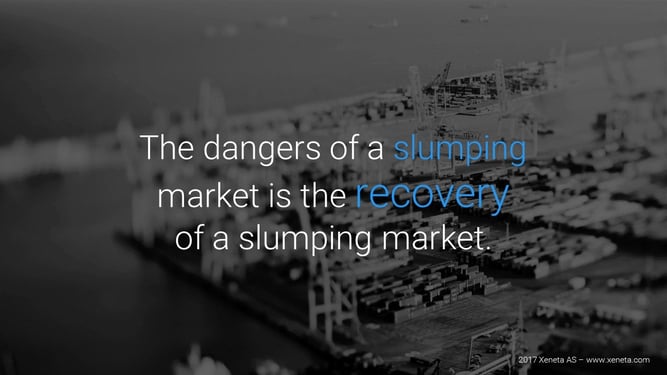
[08:18] Back in Q4, we said that the biggest danger of a slumping market is the recovery. We also saw that now in Q1, there was a lot of our customers that waited or delayed their tender to now after Chinese New Year. Also, we know that there's a lot of shippers now in the tender trying to finalize the rates for the rest of the year or for the next 12 months. It's a challenge for quite a lot of them.
Container Shipping | A Seller's Market

[08:53] What we are seeing, also what we said in Q4, is that on the Asia Europe side, but also from Europe to Asia, it's a seller's market. Rates are skyrocketing. We are going to look at now how you can monitor that through the application.

[09:28] The way that our customers use the application is that based on the input they provide to us, the rate sheet, is that we are then able to populate their account. No information is shared between our customers. Everything's confidential.
[09:47] What we do is we aggregate information into indexes on a corridor level but also on port pair level. I have prepared a couple of corridors where we would be able to look at what is now going on.
Far East Asia – North Europe (in/out)
[10:08] Far East to Northern Europe main corridor: in this overview we have aggregated more than 100,000 rates for the last 12 months. What we are looking at is the 40‑foot equipment. In the application you can select the equipment type, 20‑, 40‑, or 40‑foots high cube. You then have an area chart that shows you two different colors.
[10:29] The lighter green is the market average. Market average is the average rate amongst all our customers. In this case, for the short‑term market. Then you have the darker green, which is the bottom of the rates we receive from our customers. We show basically the full spread from the bottom to the top with the market high. I'll stick to market average and low.
[10:55] On the left side you have the US dollar amount. In the bottom you have the development from the 6th of April last year up 'til today.
[11:11] In the application you also have the abilities to then select the different corridor types, separate paired now so you can then select the long‑term rates.
[11:21] I'll drill down, also, to view what is going on the Q1. If you only want to focus on what's happened since 1st of January, 2017, you are then able to utilize the platform and see. Now, we started out in 1st of January with a rate level around $2,000. Now, the spot market rates have slowly moved down. We are at a level of $1,780.
[11:51] As I mentioned this is information updated dynamically.
[12:02] There's also ways how you can compare what is the development not only on the spot market but also on the longer‑term market. What you see here, less volatility which shows you now the development for contracts negotiated now in Q1 from 1st of January all the way up until today.
[12:27] We see now rate levels at around $1,400 as the average for 40‑foot container for longer‑term contracts down to $1,200. Obviously, at a completely different level than we saw last year.
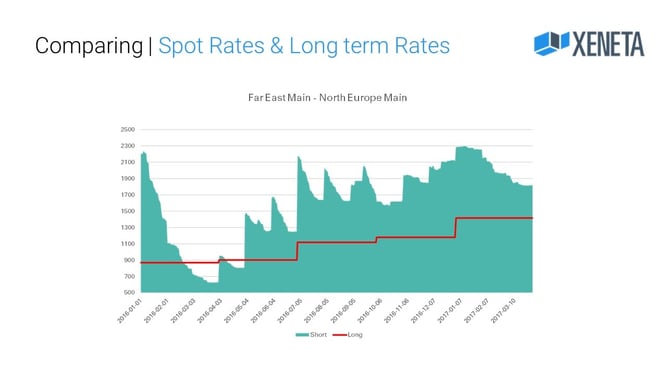
[12:52] I'll go back to the presentation, because I also have prepared a slide that shows you the combination of both the spot market and the longer‑term market. We know that there's a lot of companies now in the negotiation, and if they compare their long‑term rates negotiated back in 2016 at the same time they're pretty different than what you would be able to secure today.
[13:23] Basically, what this chart shows you is the US dollar amount, again, on the left side, the dates from 1st of January last year and up 'til today. I've then combined the short‑term market, so this is the spot market which you see here in the area chart in green. You recognize what I mentioned just previously, what I showed you in the platform, that there's been a decrease on the spot market since the 1st of January.
[13:52] But since mid‑March, April, May last year there's been a dramatic uptick in the spot market. The red line shows you now, what have shippers contracted when it comes to long‑term rates and how has that developed since this time last year. As you can see from this graph, it clearly shows also an uptick.
[14:17] What we see, as I mentioned, also, on the previous slide a lot of rates are now being contracted at a level of an average $1,250 - $1,300 for a 40 foot for the rest of the year. There's a pretty wide spread when it comes to the lowest one and then, obviously, also up to the top.
[14:44] Let’s see ways how customers are using the application. As I mentioned, they load in all data into the application. From this application they're able then to access the different port combinations.
[15:00] I can do a very, very simple search from, for example, Yantian to Rotterdam. I'll see the development over time. I'll have that in my suppliers. This is extremely important. You're only able to see your rates.
[15:18] In a case, imagine that you have an account with Xeneta. You upload the rates you have. You are then able to compare those rates against the market.
[15:27] What I just did now, I clicked on the Maersk Line rate. I'm now comparing it to the long‑term market. You'll see that it's been more or less aligned with the long‑term market now during the entire 2016. Now there's new levels coming in at higher level. Now we're looking at a 20 foot at $805. This is just an example, but this is how customers utilize the platform to get the insight.
Far East Asia - North America West (in)
[15:48] I've done the same thing for the US, just to combine spot market and long‑term rates to give you the flavor of the situation. I know there's a lot of companies now going into the tender season on the trans‑Pacific lane.
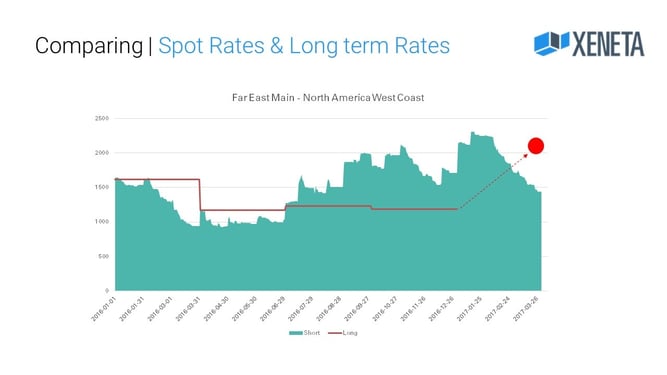
[16:13] Here, again, you'll have the dollar amount on the left side of the graph. You have the development of time since January last year up 'til the end of Q1. You have the green area chart showing the average rate from Far East to North America West Coast. Again, you see a falling spot market and then the longer‑term market is the red line.
[16:41] Like most of the contracts negotiated, the trans‑Pacific trade is done now in Q2. I can see that the rate levels for last year was pretty stable. It was a dramatic decrease from 2015 into 2016. Some of the newest contracts coming into our application at the moment, they are at a level of more than $2,000 on an average. It's going to be very interesting now to see what is going to happen on the trans‑Pacific trade.
[17:55] There's a lot of uncertainty in the market. Carriers have been able to push rate levels to a new level that we haven't seen for the last year. There are capacity challenges on export eastbound from Europe.
[18:15] Who knows how long this is going to stick, but obviously it's a huge challenge for a lot of forwarding companies and also shippers to get the space they need to ship the products they need to their customers in Asia.
[18:28] It's also going to be very interesting to now see what is going to happen, even if the carriers have been able across the board to push up rates on more or less old corridors, how will this develop now through the rest of 2017, since there still is an underlying factor of an oversupply in the fleet.
[18:52] We're going to then watch this very, very closely with Xeneta. You can also have access to this information, and then you could reach out to any of the sales representatives that you might have been in contact with, or drop us an email through the contact request.
###
Commons questions from the webinar Q&A session

Q1: At the beginning, you mentioned that prices of spot market increased in the last period. Can you mention the main reason?
A1: It depends on the corridor, but if we look at the corridor from Far East to Europe, there was a decrease in the spot markets rates, but there was an increase on the longer‑term rates.
The reason for that can be multiple things, but there has been a push from carriers to increase the rates, and there seems then to be less competition in the market at the moment, when it comes to only price.
Q2: Can we assume the rates move the same from North Europe main to Far East main as they do from Far East main to North Europe main?
A1: What we currently see is that there is an uptick on the longer‑term rates from Asia to Europe, and we could also clearly see, there's an uptick on the export side.
But the difference from spot market on the outbound from Europe to Asia, and the difference between spot and long is at an extreme high level that we haven't seen in the last couple of years.
Q3: We planned to have a sea freight tender this year, but still waiting, due to the unpredictable situation. Do you see any potential period to have a tender this year?
A3: It really depends. Back in Q4, we saw from our data on our customers that some shippers waited to see what will happen after Chinese New Year. Based on the data we have received, that was not to their benefits, because the rates now secured during Q1, was at a higher level of what was negotiated back in December.
To give any estimates for the future, that's difficult. The carriers going through the new alliances, that has an impact, and based on the situation with the imbalance between capacity, there might be more competition when it comes to winning market share that might drive down the prices, but it's very difficult to say.
Q4: What about rates for reefer containers?
A4: Today, we do not cover the reefer market. We only cover the 20‑, 40‑ and 40‑foots high‑cube dry vent container market, but it's on our road map for this year to start to cover also the reefer market.
It will take some time before we are at the level where we are comfortable with the quality of the data before releasing it to our customers.
Q5: How can we predict the rates for future, just by looking at last year data? Now the market is completely different.
A5: That's absolutely sure. What we do is that we do not do any predictions when it comes to rate levels. What we can do is that we can look at the data that was then historical, and we can also look at new, fresh data that comes into our platform to really see, "How was the development of the rates last year, and how is the development for the new, fresh rates negotiated during this time today?".
In comparing that, you see clear differentiation, and the rate levels negotiated now, during Q1 in 2017 is at a completely different level of what was negotiated Q1 last year.
Q6: Is there a way to compare between big volume BCOs and small ones?
A6: Today, we do not allow the comparison of industry or volume brackets, but we display the full spread of the market from top to bottom. There's been, and there is, a lot of questions regarding when it comes to volume. We have done some analysis based on the data that we have, and in a lot of cases, there is no true correlation between bigger has more competitive rates.
Last year, for example, we saw completely different situations where actually smaller and medium‑sized shippers received more competitive rates than the larger ones.
Obviously, there can be a lot of reasons for that, but last year, a lot of them ‑‑ the small and medium‑sized ones ‑‑ were able to take advantage of the spot market, but now might have challenges to secure the space. That said, we are planning to offer analysis on the higher level when it comes to these questions.
When it comes to, "Is there different rates for the different volume brackets? Is there rates that differ between different industries?" and so forth, that is something that we are going to offer now during 2017.
Q7: How do you manage contracts subject to peak season surcharge, and can you separately show the different PSS levels negotiated?
A7: What's unique with the application is that rates come in with a "Valid from" and a "Valid to" period on the rates. If there is an increase of, for example, one month rates, they expire, and the new rate, with the PSS is then made and activated in the platform. We can always reflect the current market prices based on the data we receive from all our customers.
That's also why it's can see clearly increases and decreases by monitoring and using the applications, because it's updated on a daily basis on the input from our customers.
Q8: Are you able to measure inland haulage?
A8: Today, we are not able to offer any comparison when it comes to port-door, although we have exceptions when it comes to the North American market. There is an ability to compare to rail ramp in Chicago, for example, and other ports in the US.
Q9: Will we get to a point this year where annual rates would be beneficial again?
A9: Based on the data we have, the longer‑term rates are moving upwards, but it depends now when rates go up to a certain level, and carriers are able then to secure them at a much higher level than they were last year, if then they go back to fight for market share again, but it remains to be seen.
###
If you missed any our webinars – or simply want to refresh your memory – you can access all of them on demand here.
See you next time!


