


Q4 2016 saw an immense increase in container rates possibly moving the shipping industry to a seller's market as we enter 2017. However, in our webinar we addressed that the market is still uncertain and ocean freight rates can very well begin to drop again if overcapacity is not addressed.
In our webinar, Patrik Berglund, Co-founder & CEO, Xeneta, reviewed shipping rates for the main global routes, covered key concerns and answered live questions. Click here to access the webinar recording.
Why You Should Watch the Webinar
- You need to know how the ocean freight market prices are moving as you prepare for your RFQ
- You need real-time data to benchmark your container prices for the spot and long-term ocean freight market
- You need container pricing data to help you negotiate better with your shipping suppliers and be convincing in your discussions
Get the Webinar
Click here to access the webinar recording.

- Presentation transcript: Read below (or download full transcript in PDF format)
- Live Q&A session: Read answers to common questions from the webinar
Presentation Transcript
[Patrik Berglund] :
Today's Agenda
Xeneta | A Brief Introduction
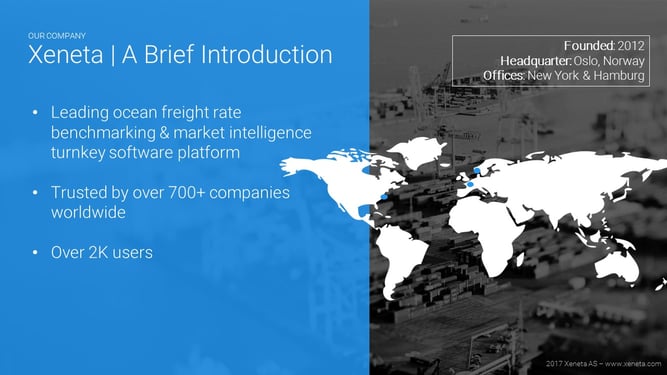
First, a little bit of the basics of Xeneta. We're an Oslo headquartered company with offices in New York and Hamburg. We built an online benchmarking platform that sources data from BCOs, shippers, mainly, but now, also, some of the supplier side companies, mainly NVOCCs. We have more than 700 companies connected to the platform and more than 2,000 users.
World’s Largest Database of Contracted Ocean Freight Rates
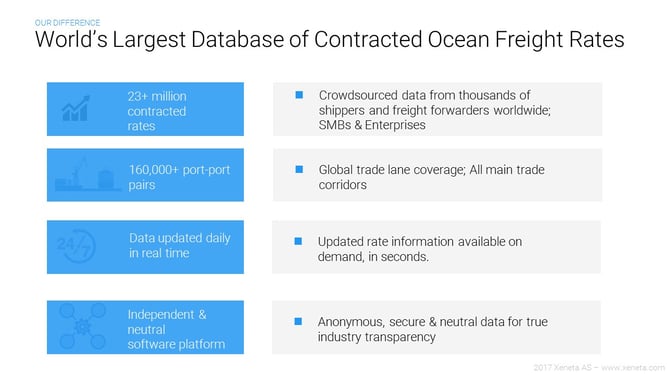
What's key to understand about the approach we've chosen to build our benchmarking tool is that we've built a technology company that allows a lot of parties to connect and upload fresh data all the time.
When we hosted our last webinar, I believe we had a database of 17 million contracted ocean freight rates. Now it's grown to more than 23 million. It's growing very aggressively as new companies join the platform. This data is crowdsourced worldwide, but we key target larger volume BCOs.
Our user base is built up by anything from 500 TEUs per annum to more than 500,000 TEUs. With this set of data, we're able to cover more than 160,000 port pairs globally and so we can release benchmarks and price development historically on more than 160,000 port pairs.
Did you know we have more than 23 million contracted rates? Yes! #X_Webinars pic.twitter.com/DUYXFpLEUE
— Xeneta (@Xeneta_AS) January 17, 2017
Data is pulled into the platform daily. We have a dedicated ocean freight rate management team that constantly works with data. Cleansing, validation, and all of that.
The key thing about Xeneta is that it's independent and neutral. There is no ownership stake in the company from either the buyer or the supplier side of the industry, which means that we are in a good position to provide this kind of intelligence without compromising the business of any of these stakeholders.
Xeneta Data
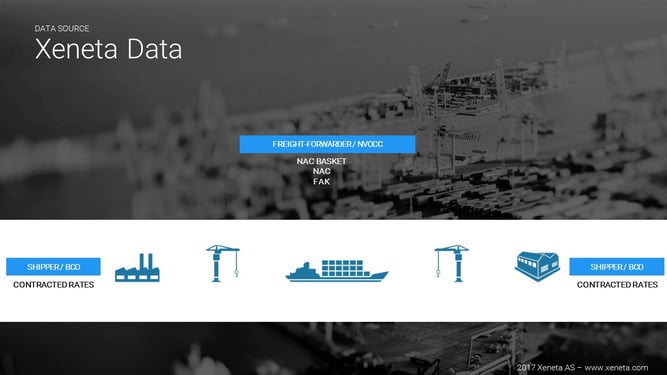
What's key to understand before we go into defining the developments, it’s where we source the data. I mentioned it briefly but if you take this very simplified approach, we get the data from either the shipper or the consignee in a supply chain. They connect to the platform and upload their contracts.
We also source data coming from NVOCCs / Freight-Forwarders – which could be FAK, NAC Basket and NAC rates – but whichever data we receive; we tag it – so that our customers can segment out the data they’d like to review – to capture relevant market trends. I'm going to show you this once we start using the tool live later in this session.
2017 Challenges in Shipping Market
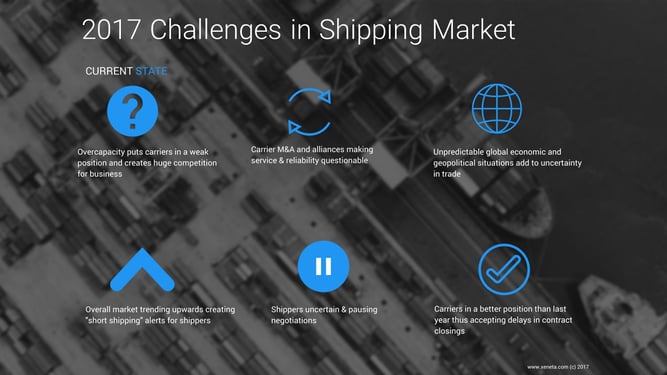
Before we go into that, I want to talk a little bit about the market, how it currently looks like, and what challenges we see going forward. There's still a significant amount of overcapacity which, in theory, puts the carriers in a weaker negotiations position.
2016 has also been a year with some events like the Hanjin saga. They went bankrupt. There's been a lot of M&As. The market, at some point in 2016, was at such a low level that it wasn't sustainable and we of course, saw that already late 2015. It's been like this since March and June for the trans Pacific and March for the north European one. It's been trending upwards since. We're going to look at the charts and we're going to see how it developed.
All of these M&As, as well, have created a lot of uncertainty with BCOs, shippers that report to us about who they are actually contracting, which string specifically do they get when they secure a contract, and what can they expect out of transit time, reliability, and all of that.
There's also macroeconomic things. As you all know, there's been a change of president in the US. There's a lot of uncertainty. How will global trade develop with that? Will there be flows of cargo going in other directions? A lot of uncertainty for both the buyers and the suppliers in a supply chain.
As I mentioned, the market is ticking upwards. Data has also changed the mindset of a lot of our customers - earlier it's been about getting a cheap price while now it's getting the right price so that they can actually get their cargo moved within their supply chain. A little bit less focus these days on the cheapest price and more on what is a competitive and fair ocean freight price to operate with.
Another major event we've seen when we closed Q4 is that a lot of the contract negotiations on the Far East Asia and North Europe has been postponed which is because there's a very uncertain market at the current time. It's trending upwards but the overcapacity actually dictates that it shouldn't go up this much. Shippers have then stepped aside from the table. When carriers accept that, you can argue, at least, that they expect an even better position to negotiate from later down the road.
We all know that the Chinese New Year is coming up. Traditionally we've seen significant rate increases in relation to Chinese New Year. If those increases stick in the market, then carriers will actually be in a much better position to negotiate long-term contracts. It might be a very favorable move from the carrier side, as well.
Container Shipping | A Recovering Market
One thing that we said throughout 2016 is that the danger of a slumping market is actually a recovery one. I think we're right in the middle of that and have been for some months, which has completely changed the dynamics. Since November 2016, I'd argue that there's been more of a seller's than a buyer's market.
Container Shipping | A Seller's Market

It definitely has been a buyer's market for the previous 2.5-3 years where there's been a constant downwards trending market. Now that's started to pick up and it creates a lot of internal fuss and confusion amongst the shippers and BCOs that we deal with. It's a struggle to get their bearings and decide which strategy they will do for with their 2017 contracts.
At this moment, the ocean freight market looks like a seller's market. Do you agree? #X_Webinars
— Xeneta (@Xeneta_AS) January 17, 2017
Main Highlights Q4 2016 | Ocean Freight Shipping Short-term Rates
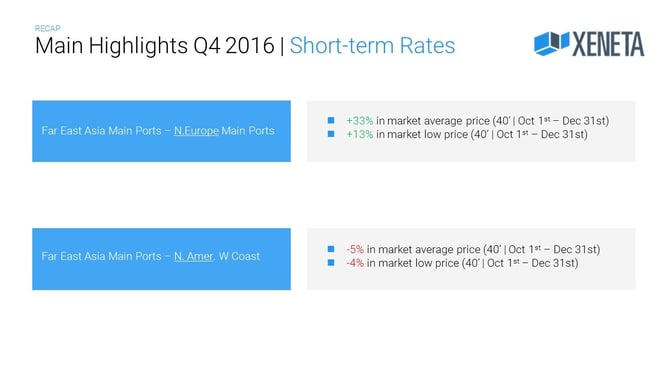
Some of the main highlights for Q4 on the short-term ocean freight rates, as we saw from Far East Asia main ports to North Europe main ports, the market average for 40’ picked up 33%, while the lower end of the market picked up 13%. You'll, of course, see the same correlation with 20’ and 40’. These are the values going into the quarter versus the values exiting the quarter.
Additional info on rates from the webinar....#X_Webinars pic.twitter.com/iMWnfe9GZi
— Xeneta (@Xeneta_AS) January 17, 2017
On the Far East Asia main ports to North American West Coast, it's still, for short term rates, there was actually a slight dip in the short-term market from when we entered the quarter and exited the quarter. 5% for the market average and 4% for the lower end of the market.
Main Highlights Q4 2016 | Ocean Freight Shipping Long-term Rates
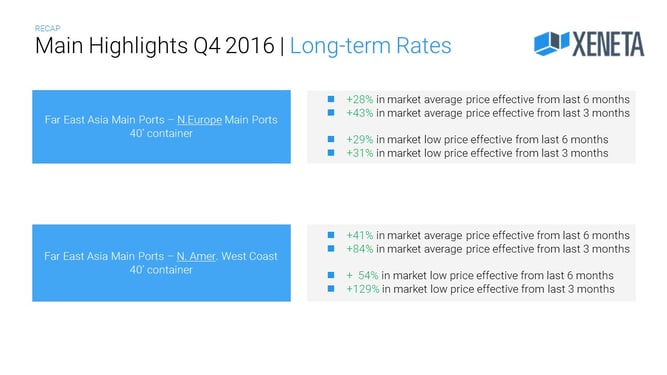
If we switch to long term rates, you will see that for the Far East main ports to the North Europe main ports for a 40’, it's interesting to see that if you slice out long term contracts but remove the old data so that you only look at contracts that went into effect over the last 6 months, there was a 28% uptake on long term contracts for the average. If you do the same exercise but narrowly filter down so you only look at contracts effective from within the last three months, then the uptake of the average was 43%.
We've made this case now for a long time saying that the long-term market moves accordingly to the short-term market, but with a delay, simply because of the contracts expiring later on. This is what we see now on this corridor, that it started picking up in March for the short-term contract and then in June the long-term contracts started to follow the same pattern. Different uptakes in different points in time, but still, pattern wise, the same.
You see that the lower end of the market for contracts that were 6 months old or newer has picked up with 29%, while contracts effective from within the last 3 months has picked up with 31%.
There's slightly bigger numbers on the Far East Asia main ports into the North American West Coast. For 40’ you will see that 6 months old contracts have gone up with 41% compared to the full set of contracts for 2016. 84% increase if you slice out the last 3 months contract and the lower end of the market for the contracts effective from within the last 6 months has gone up 54%, while there's a significant bump on the lower end of the market for contracts effective from within the last 3 months of a whopping 129%.
We definitely see the same trend on both these corridors compared to what we saw in the short-term market and I want to use the tool now to go through these highlights.
Xeneta in Action | Container Freight Price Comparison & Shipping Market Index Platform

I'm going to switch over to my browser where I've prepared these different corridors.
You'll see here that we're looking at Far East main ports into North Europe main. I've selected a 40’, Q4. This is showing price development for short term contracts from 1st of October to 31st of December 2017.
On the Y axis you have the US dollar value and when I move the mouse cursor you will see the actual US dollar value on any specific date. We went into the order with an average rate for a 40’ of $1,416 US. Then a couple of GRIs entered into play, one in November that stayed fairly well compared to historical GRIs. Then another one, beginning of December and mid December which then picked up the market to $1,878 US short-term market.
It's imperative to have a slightly longer time perspective on this, so what I'm going to do now is to use the slider. I'm going to do a 12-month historical overview. Here you will see what we pointed out earlier, that the market bottomed in March with the average at 479, and then, at the end of the year it was 1,878. I can, of course, push it so that we can see the latest price development all the way up until today, where the market average sits at $2,052 US for short term contracts. Then I can include the spread of the market so that you can see how the lower end of the market has lifted itself significantly to $1,333 US. Back to March, it sat at $158.
I want to show this in percentage, as well, so you can see how drastic of a change that is. If I go back to 27th of March and I switch this to percent you will see that the lower end of the market in March has moved up with 744%. The average has gone up with 328% for a 40’.
That's how the market has moved for short term contracts from Far East main ports to North Europe main. The reason why this is very important to look at is that this development and these patterns are reflected in long term contracts.
Now, I want to look at the same corridor, but long term contracts. I'll start by looking only at Q4. As you can see, for long term contracts the average in Q4 was fairly flat. Hardly any change. The average, sat for the full quarter at $947 US and the lower end at $500 US.
Then, if we want to see the development over the full year, we will see that there's been some movement but, again, these numbers down here don’t change that much.
What's interesting is to see the change in long term contracts relative to short term. In order to visualize that one, I need to segment out the data. I can't look at all valid long term contracts over a period of time, I need to slice away old contracts.
What I prepared here is a long-term contract over a year for a 40’ container where I only look at contracts valid within the last 6 months. Then you will see that the market average has moved up to $1,177 US, which is $230 US up from the previous graph we looked at.
The lower end of the market has moved up to $621 US, which is a $121 uptake. Third one, if you slice again and you take out only contracts starting date within the last 3 months you will see that the average keeps on moving up to $1,308 US and the lower end at $765.
The lower end moved another $144 US up, while the average moved $131 US up compared to what was valid within the last 6 months. This clearly shows the uptake I'm talking about. This is paramount if you run your RFQs, these are the relevant benchmarks that you would inject in that.
Even slice it one level down further to look at what's been currently negotiated this specific month for long term contracts, which we have available for our customers.
Final graph I want to show on the Far East main to North Europe main corridor is this one. What I've done here is that I've selected future valid contracts. I wanted to give you a glimpse of what is happening the next 90 days based on contracts with effective from date within the last three months.
The point here is that it's a very slight marginal uptake from the previous graph we saw, which might mean one out of two things. It might mean that it's reached a level where it will flatten out or, as I mentioned earlier, the fact that there's a lot of long term contracts currently being pushed so that the expiration date is moved to the end of February and the end of March. Traditionally, this corridor has been tendered accordingly to the calendar year but this year we see a huge change in that due to the high level of volatility, high level of uncertainty.
Both the supply and demand side has postponed a lot of the negotiations so that we will continue to get fresh data in over the next couple of months to see how 2017 looks like for long term contracts.
Then I want to cover the other corridor, which was Far East main ports into North America West Coast. As you can see here, I selected a 40’. Again, I'm going to start with short term contracts for Q4, 1st of October - 31st of December.
As I pointed out on the highlights, there was a slight marginal decline on this corridor, both for the average and the lower end, but as you can see in a more granular view like this, you will see that we went into the quarter with an average of $1,808 US dollars. Then it peaked at $2,106 before it bottomed out at $1,511 US for the average and exiting the quarter at $1,716 US.
Less movement on the lower end of the market here, but again, key to understand the market will be to see how short term rates have developed over a longer period of time. Again, I'm going to use the slider to give you an overview of how the market has looked like for the last 12 months.
Here, you will see that the market bottomed out during Q2 Q3, beginning and end of Q2, mainly. Approximately at $947 US, $600 US on the lower end. Then we exited the year at $1,716 US. Lower end stood at $1,243. Then you will see a significant GRI effect now in January in this corridor.
The same exercise here. If I select a point in time where the market bottomed out, the 31st of May, for instance, and then flip it so that we can see how the market has moved in percentage, you will see that the short term markets since it bottomed out in May on this corridor has moved up, for the market average, for 139% and the lower end is lifted with 93%.
Again, this is relevant for long term contracts because now this corridor is tendered in April May, so that the foundation for negotiations on this corridor will be depending on how this continues to develop as the main chunk of volume, is tendered in April May for this corridor.
If I then switch to long term contracts and look at only Q4 to begin with, you will see it was a very flat quarter, entering at $1,206 US dollars and exiting at $1,311 US. The averages, of course, then are very close to that.
If I look at the price development over 12 months you will clearly see the tender cycle that I just talked about here for going from April 2016 into May 2016 where a lot of new contracts come into play. That shifted the contracts from '15 into '16 downwards.
This year, with the development of the short-term market going up instead, we will see an increase. If I do the same exercise and look at long term contracts on this corridor, negotiated last 6 months, you will see that the values are now very different.
The market average now sits at $1,758, which is an uptake of $472 US compared to the full data set for 12 months. The lower end of the market sits at $1,106 US, which is a $376 uptake. Then, of course, the same exercise can be done so that we slice the data even further and look at what's been on the contracts that are valid within the last 3 months.
Then you will see that the average sits $2,350, which is another $592 US up on the average. Lower end, that's $1,793 US, up $687. There's a clear upward trending long term contract pattern on this corridor, as well as with the European one.
We see that historically the trans Pacific corridor correlates in terms of patterns and movements to the European one, but since the tender cycle is run after the European one, then it shows with a slight delay. The same principles apply. There's always, of course, BCOs and shippers that tenders off cycle which allows us to capture this data and see how it develops a bit more frequently than on an annual basis.
That will be the walkthrough of the two different corridors that we intended to cover today.
Just to mention one last thing before we go into the Q&A session, from a BCO/shipper point of view whoever runs their RFQs now need to have fresh, valid data in order to set relevant targets in their RFQs. I believe that is the main value proposition that they should be on the lookout for now with this data set.
Secondly, I think it's key to keep an eye on how the short-term market develops post Chinese New Year because if, as we've seen historically, it plummets quickly after that then it might very well rapidly change from a seller's to a buyer's market again.
If it sticks, the shippers sitting on the fence, waiting for Chinese New Year to blow over, they might have lost out on the opportunity to contract, as they've done historically, according to the calendar year for Europe and then, as quickly as possible, for the trans Pacific corridor.
###
Commons questions from the webinar Q&A session

Q1: When will be a good time for shippers to finalize Asia‑Europe long-term contracts?
A1: If you hadn't already done it at the end of Q4, I might be very tempted to say to wait until the end of Q1, at least so that we can see what happens post Chinese New Year with short term rates. I think it's a big risk that shippers / BCOs have taken postponing it, but now it's already done and it's done with such a huge amount of volume of contracts that I'd be keen on waiting maybe closer to the end of Q1.
I've got to stress that this is a risk because, if the rate increase related to the Chinese New Year stays, then shippers will be worse off waiting to off-the-bat lock it in, compared to what they would have been doing before.
Traditionally, the rates plummeted after Chinese New Year over the last few years. It might very well be the same because we know there's overcapacity.
Q2: In light of the very volatile 2016, will it be more sustainable for carriers and shippers to move toward a cost‑based pricing model than a market‑based pricing model?
A2: That's a very interesting question, to be honest. I think it really depends on whether most sides are willing to do that, especially on the carrier side.
You've got to keep in mind that over the last 3 years the carriers have lost something like $16 billion. The carriers need to win back some of their losses.
What I do think there's a lot of interest around, is to do index‑based contracts with fixed validity periods depending on whether you want to go short or long‑term on the contracts. In fact, we're actually setting that up between buyer side and supplier side, and we've been doing so for the last 4 or 5 months. That is, of course, an interesting development to secure a competitive rate in the market at any given time.
Something to think about from Patrick...use of index-based contracts. Interesting idea, are your contracts tied to an index? #X_Webinars.
— Xeneta (@Xeneta_AS) January 17, 2017
Q3: Going forward, it's better to agree on short and long‑term contracts with shipping lines?
A3: Excellent question. That depends on the flexibility from our point of view, and the flexibility from the BCO point of view. If I were a BCO and I had the flexibility to shift some of my volume into the short‑term market, I'd definitely consider that option and do maybe 70% on a long‑term contract and 30% on a short‑term one.
Operationally, strategically, and technically these are very different markets, and it requires different attention, amount of resources attached to operating in the short‑term market. What we have seen a lot of our customers do is that they've gone from fixed annual contracts into shorter time spans in order to capture some of the movements of the market. That would mean maybe to go from annual fixed fee to quarterly fluctuating prices.
Q4: Do you expect carriers engaging in price war due to this influx of alliances?
A4: I'm curious to see how these alliances play out, to be honest. Traditionally we have seen price wars as soon as the market picks up a little bit, which is the difference for the last 9 months here.
The market has had a GRI, and then someone has stuck out their neck and reduced the ocean freight rates in order to try and win market shares because there's so much over capacity that whatever you can deliver as volume, it has been highly appreciated by the carriers.
The main question I have would be whether someone does this now post China's New Year because then, as I pointed out, it might very quickly change from a seller's to a buyer's market again. Hopefully from a carrier point of view and for the sustainability of this industry, none of them will do that.
Hopefully, it will stick because we are all dependent, whether it's me personally or whether it's the shippers/BCOs. We're all dependent on having competitive, functional market of carriers out there.
Q5: We have not yet dared to go into index‑based pricing because we don't think there are enough indexes available for a variety of trade links that they have, Europe‑US, Europe‑APAC, Europe‑South American, Intra‑APAC. How do others solve index‑based when they have a big variety of trade lanes?
A5: I think that's one of the core problems and I definitely agree. I think we're the only source with the vast amount of data that can actually discuss those trade links. I know that's been one of the key challenges for larger volume BCOs. We have shippers in our database with more than 7,000 trade lanes around the world.
To do index‑based pricing on all of those requires vast amounts of data. We would have 90% coverage for a company such as that, which would take care of probably 98% of their volume. Data density is a key here.
It's a prerequisite to doing index‑based contracts, and it needs to be accurate and reliable for both the buy and supply side. That's, of course, one of the reasons why we on‑boarded the supply side to the platform as well.
Then it's a question about how far back we have historical rates for. That, of course, depends on what we've received from the users. To give you these two specific corridors that we covered today, Europe would be capable of going 2-3 years back and US‑based one to a couple years back as well. Then most other corridors, especially for long‑term contracts, would be a couple of years.
Index-based pricing is indeed difficult to do. Need data density that is accurate and reliable. Our platform can help! #X_Webinars
— Xeneta (@Xeneta_AS) January 17, 2017
Q6: How does this data different from other freight indices such as SCFI?
Q6: SCFI would be the Shanghai Containerized Freight Index. Let me be very clear about that. That's out of Shanghai. We cover more than 160,000 different port-to-port pairs. Whether you ship from Tokyo to Sidney or whether you go from Santos to Antwerp, the data is in our platform, which you couldn't be finding on SCFI.
Secondly, SCFI only covers short‑term data. That would mean that outbound Shanghai would find correlating with our short‑term data, but the true value with Xeneta for larger volume BCOs would be the contracted data.
Q7: Are there any plans to use volume commitment levels in the tool, as opposed to short term / long term contracts?
A7: Of course, we have a lot of conversations about the whole volume piece. Let me first explain a couple of things. We've looked into segmenting volume brackets so that you'll have 10,000 to 20,000 TEU BCOs benchmarked against other BCOs with the same volume and the same trade patterns and so forth. What we found out very quickly is that you will have a 10,000 TEU BCO/shipper outcompeting the rates of a 100,000 TEU BCO/shipper. It has to do with timing very often.
It also has to do, of course, with the focus you might have internally. Whether you focus on the cheapest rate in the market, or transit time, or the merge and the tension. We wanted to avoid a situation when let's say you're a 100,000 TEU shipper, you would filter out all the 10,000 TEU shipper data, and so you would lose out on valuable market insights.
What we found out is that if you historically do this benchmarking exercise you will map out your position in the market. Then the challenge becomes to maintain that position in order to stay competitive.
That way you will indirectly incorporate volume into how you read the charts. That being said, we do a lot of customized reporting and we have volume data so we're, of course, able to also play with those kind of analysis.
Another slightly related answer to this topic will be to discuss these enforceable contracts. That seems to be more of a focus these days in the industry. Today a contract between a shipper/BCO and a carrier often is more like a price agreement than an actual contract.
We see contracts delivered where volume commitments are not being held both ways either through short shipping or simply not delivering the bookings that the BCO shipper places.
###
If you missed any our webinars – or simply want to refresh your memory – you can access all of them on demand here.
See you next time!


