


Last month, Michael Braun, VP, Customer Solutions at Xeneta reviewed the past quarter's ocean freight rates in a live webinar. He analyzed the main trade routes Asia - Europe (in/out), Trans-Pacific and Trans-Atlantic. Michael discussed how rates between the Far-East to Europe have seen an upward trend due to the increasing bunker costs over the last quarter. He shared how the new tariff strategy from the US has increased volume and affected ocean freight rates. Michael recommends to closely follow trends on the trade routes connected to the US market, both from Europe and from Asia.
Click here to watch this webinar and learn more about the trends on the main trade routes and get insights to improve your freight procurement strategy.
Get the Webinar
- Presentation transcript: Read below (or download here the full transcript in PDF format)
- Live Q&A session: Read answers to common questions from the webinar
/Jan%202018%20Thumbnail.png?width=659&name=Jan%202018%20Thumbnail.png)
Webinar Transcript and Q&A
Swati Kakde: Welcome to our webinar, "Ocean Freight Rates at a Glance." The main goal of this webinar is to give you an overview of the past quarter's ocean freight rates through our platform.
Michael Braun: Within the next 20 minutes I would guide you through a high-level overview of our services. Then we will go into our platform to get live results on ocean freight rates.
We think there has been little transparency in this volatile ocean freight market. We provide accurate ocean freight benchmarks and market intelligence for all industries
After 6 years since we started, we have now 80 employees, most of them working out of Oslo in Norway. We also have offices in Hamburg and New York to be closer to our customers. We have now reached a database of 75 million contracted rates, out of which 2.5 million come in every new month.
This enables us to provide market intelligence on 160,000 different port pairs 24/7. It's not a quarterly or yearly update, it's 24/7. You get daily rate indices from us on all these 160,000 port pairs.
/Slide6.jpg?width=599&name=Slide6.jpg)
We are independent and neutral. We are not working with any specific carrier or freight forwarder. We get data from both, freight forwarders and shippers, all buying rates and we deliver our services to all members of the industry.
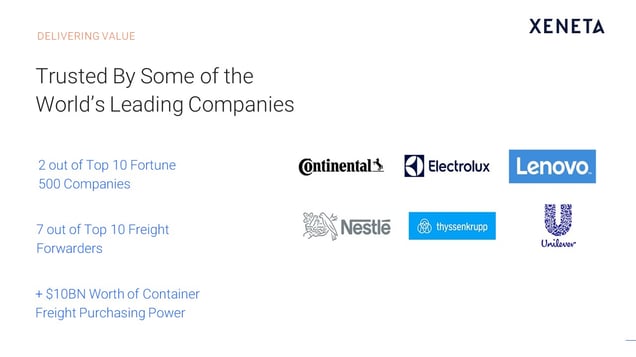
A lot of the freight press is using us specifically to refer to the latest ocean freight development. We are happy to serve the largest companies in the world. Our customers include 2 of the top 10 Fortune 500, 7 out of the global top 10 freight forwarders and around 200 shippers. The overall customer size is between 700 and 800 now.
In addition to the services we provide, we have an annual customer summit. Here are our latest pictures from the summit, last week, where we welcomed over 100 customers from all over the world and discussed the latest in our ocean freight industry.
Let's look at what are some of the key customer deliverable and how they use us? They're two different
- Monitor the market and see what the latest market development has been.
- Assess their own buying performance and see how good their own performance has been. Then derive use cases out of that to apply them to their next upcoming tender.
- They can also link it with our indices - Xeneta Shipping Index (
XSI) so that they don't even need to tenderany more , but just link it to our index. - Reporting for internal stakeholders or measuring the procurement success.
/Slide11.jpg?width=608&name=Slide11.jpg)
For the freight forwarders, it's similar. They use it to
- Track the daily market. We have the spot market and the long‑term market
- Sales development, as we provide additional insights and more transparency. Or, if they are linked with Xeneta Shipping Index, they can provide their services to rate levels, which are linked to our shipping indices.
- Save resources for their operational tendering, or just as a reference for their customer management.
/Slide12.jpg?width=624&name=Slide12.jpg)
In some cases, with the Xeneta Shipping Index we link the two sides. We provide adjusted rate levels on a monthly, quarterly base using our market data and then provide index rates. They link their business with each other's to save energy and resources from the constant rate updates and tendering.
On the other side,
/Slide13.jpg?width=621&name=Slide13.jpg)
That's a quick introduction to our company and what we do. The purpose of this session is to give you a glance into the latest market development.
We're going to go into the four major trade lanes:
- Europe to
Far East, thenbackwards - Transatlantic
- Trans‑Pacific
/Slide14.jpg?width=556&name=Slide14.jpg)
You can drill down the results for 160,000 port pairs in our app. We are looking at four of the main trades on a high level to give you insights on what kind of information you can pull out.
This is now the overall trade from Europe to Far East Asia where we look at the latest market development. If you were a shipper or a freight forwarder and providing us your rate levels, then you would be able to access the same level on the benchmark side, which would mean that we mirror your own rate levels, being laid over on a long or short‑term contract, compared against this kind of
The latest market development, what you see here, are in two different levels. It's the short‑term market and the long‑term market. The short‑term market is the spot market with contracts less than a month.
The long‑term market is the blue rate, from three months to up to a year. We always measure the latest tendered contracted rates, which just came in, within the last couple of weeks, out of the tender period so that you always get an absolute up‑to‑date picture of the long‑term contracted market as well.
We are transparent when it comes to our data. What you can see on the right side, the number of contracts, so you can always rely on how many different contracts and users have supplied the data.
This is live data. We are now up to the mid of October. You see that the average is $762 for a Gate In/CY rate, which you can refer over here. That one can be also changed
As we are on a very high level geographical hierarchy, there are a lot of contracts to be loaded. On this next screen, we see the development the other way around, where you can see the volatility on the market. The short‑term market with the general rate increases coming in, going up and down. Sometimes, we have a downward trend where then the long‑term market is following in some time. You can see here, overall from the
It's a similar and parallel development to what we have seen last year at the same point of time. That was then stopped by general rate increases at the beginning of November to hold the downward
Although, we know that this trade is an important one for the profitability of the carriers. If that one is going on a downward trend again, like in previous years, this will have a significant impact on the profitability, which has, overall, on the global level, been not that successful and good for the carrier side in the first half of the year.
It will be interesting to see if the kind of successes achieved in the first half of the year
Now, going back to that one, as I said but from Europe to the Far East. As you can see here, it was a huge impact last year with the short‑term increases and the artificial capacity reductions at the summer time last year, followed by an up‑growth in the long‑term market.
Since then, this market had been stable and not that much has been going on. Also, not on the highest profitability level, still a little bit higher than the earlier days, as you can see over here. There's been an increase of around 10%, or 5‑10 % compared to the rate levels the year before.
Overall, it's a very calm market for the time being. There hasn't been any volatility at all compared to the other markets in the world, or especially like the one we have just seen from the Far East to Europe, where there has been a constant up and down and general rate increases over a couple of lanes.
That one, at least for the time being, needs to be followed much closer than
Other rates within the last couple of months have been more volatile. The ocean freight industry is dependent on
With the new tariff strategy coming up from the US government, then on top of that any kind of counter proposals and reactions from all the governments. You could clearly see that since this kind of initiative has started, in the second quarter of this year, the freight volumes have significantly increased as everybody tries to import its goods before the tariffs get into place.
We have seen for a long time now, shortened capacities and increased volumes towards the US market. That also resulted in a significant increase
While it was a very calm year at the beginning of the year, and also the TPM didn't show any signal at all for a change, even announced a downward trend then. Since the tariffs have been imposed the picture has been unexpected from one day to the other.
When it was announced it was clear these things have resulted in higher trade rates, freight rates, significantly higher general rate increases, and also successful implementation, which have now led to a doubling of the rate levels, more or less, compared to the rate before.
We see a 65% or sometimes we've got a 75% increase in rate levels. If we get closer to what we have seen at the beginning of the year, we are even up to a 90% on the short‑term markets, so literally a doubling of the prices.
The long‑term market is now following suit. At least
Here it will be interesting to see how long this kind of
Same applies to the trades on the Transatlantic. It's exactly the same. There has been a significant increase, as you can see, plus 30% on average from the last couple of months until today. There is not a real signal that this is going to change, at least for the time being. There are still successful general rate increases out there.
For the time being, there hasn't been a downward trend
All of the markets which are related to the US market, both from Europe and from Asia, clearly have to be followed closely within the next couple of weeks, because at one point the volumes will significantly drop, and then we will most probably see the corresponding effects on the rate levels again.
It makes sense to have a platform like Xeneta to follow this kind of latest market development down to a single day and also on a global level. This is important because it's not only reflected on these things, but it's also a very good way to track, then, the implications of the IMO 2020 regulations.
As you might have heard already, there will be stricter fuel regulations coming into place in 2020. As the carriers have to prepare beforehand, and also implement these before the starting date, there will be cost implications in 2019.
A lot of carriers have now announced rate increases following
Some of the shippers have received or are just about to receive the first level bids from the first rounds. It will be interesting to see, what is the new trend coming up with
As we said earlier in the session we see a calm situation from Europe to Asia, a downward trend from Asia to Europe, and pre‑pull effects towards the US regions.
All these are not signals for a stronger market, especially as we get new capacities being pulled into the game. The market doesn't look for an increase, so apart from the IMO regulations, and that's probably the reason why these rate improvements have already been imposed for the beginning of the year. That's the only thing which has vowed to keep the right levels up.
It will be interesting to follow the market, if this is going to be successful, or if we first see a downward trend on all of the levels when your pre‑pull effects are taking out or running out. Those are some of the important things to be followed within the next couple of weeks and months. Our customers can visualize daily.
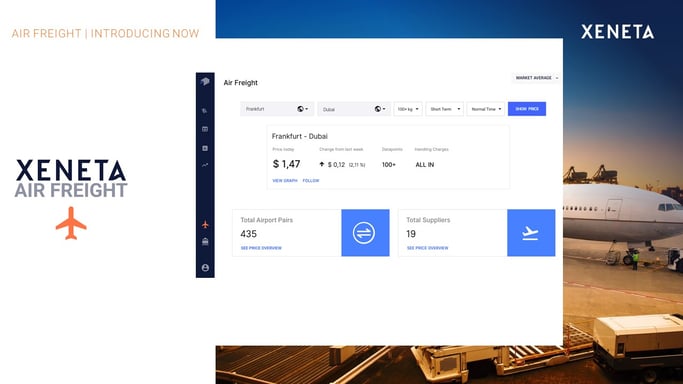
Before we go into Q&A session, one last comment on my side. The same thing, what you have seen on the ocean freight, we also support on the air freight side. We have a similar tool available for air freight.
We have
###
Webinar Q&A Session
Q1) How long is the long‑term contract?
A1) At Xeneta, we define long‑term as longer than three months, but most of the customers have yearly recurring contracts, most of them with a three‑month bunker adjustment clause.
Q2) What tender format do you require from your customers?
A2) A final allocation sheet from the tender in their own form. An Excel document where they then at the end define the final allocation towards the carriers or freight forwarders.
Q3) How do you collect the data from freight forwarders and shippers?
A4) Excel is still the tool to be used mostly within the ocean freight industry. From shipper in most of the
Same applies with the information which has been provided by the freight forwarders. From some we get hundreds of sheets with all their applied rate agreements. In some other
Q5) Do you track, also rates for shippers' own 20‑inch ISO tank containers?
A5) Yes, we do. We do also have reefer containers, 20‑ and 40‑foot, as well as tank containers within the analyzers in the tool. Not with the fully‑blown same coverage than with standard dry containers
Q6) Can Xeneta further assist in procurement?
A6) We do have our index‑based offering - XSI. We do provide rate indices for the procurement, so bringing in rate levels for the future contracts. In that
Our information is being used for analyzing tenders, or is being put into tender tools, or uploaded into tender tools, but not that we provide the tender service, or booking service by ourselves.
Q7) What are the BAF increases received so far for closed tenders, as you mentioned the carriers are incorporating IMO 2020 into rates?
A7)] The BAF increases, which have been received so far, they are included in our total rates. They will be also included in the future, which at one point in time we are going to see an increase in rate levels due to BAF.
For the time being, mid of 2018, there should not be any kind of rate increase due to the BAF IMO 2020 regulations, so definitely not.
Q8) Can you predict rates?
A8) No, we don't. The only thing what we see, we do have an estimation of the market, or a kind of a guess, which we also share in sessions like today, but at the same
Unfortunately, there is no crystal ball available, but we can do deductions or expectations, at least for the long‑term market, because that one is usually driven by the short‑term market development beforehand.
Apart from that, when the next year rise is coming, how the markets are behaving, here we are completely dependent and reliant on our data, what we receive with already contracted rates. That will always be like this, so we will never give any kind of predictions or forecasts.
We will always only rely on information which we have gathered through our own database.
###
If you missed any our webinars – or simply want to refresh your memory – you can access all them on demand here.
See you next time!


