


Opaque ocean freight rates based on massive price fluctuations can hamper your groundwork for the 2018 tender season. That's why greater visibility into real-time rate data gives an incredible advantage to your sourcing activities.
Enter subject matter experts, Michael Braun of Xeneta and Florian Dussler of Transporeon Group Americas. During a live webinar, they did a walk-through on how to integrate ocean freight procurement data into an intelligent bid tool to facilitate smarter decision making in negotiations.
To paraphrase an attendee's comment, "running tender benchmarks in conjunction with a RFQ process is a match made in heaven."
Webinar - Transportation Supply Chain Professionals Shifting to Data-Driven Informed Decision Making
- Presentation transcript: Read below (or download full transcript in PDF format here)
- Live Q&A session: Read answers to questions from the webinar below
Presentation Transcript
Florian Dussler: [00:48] Welcome everyone. We are very excited for the upcoming webinar to present the audience the challenge that's going on with procuring freight in general but particularly procuring ocean freight.
Michael Braun: [01:47] Thank you, Florian.
[01:54] What would we like to offer in our positions from our companies, TRANSPOREON and Xeneta? It's mainly about how the ocean freight industry has changed completely within the last couple of years and is actually moving on further towards a kind of buying approach and buying behavior, where we go more and more into data‑driven analysis and, yes, procurement tendering RFPs instead of just the procurement pure out of long term relationships and steady behavior.
[02:25] More and more of our clients are nowadays using databases, computer‑based analysis of tender bits and so on. This is exactly the fields where we are active and where we would like to supply our customers with outstanding solutions on web‑based and cloud‑based platforms.
[02:46] Because we think that, over all, the times of pure Excel tables and, yes, complex Excel databases are over. That in order to make a real profound database decision making you need to have a proper tool in hand, which is just accelerating your processes.
[03:05] Which is just doing the calculations for you, and which also gives you the kind of state of the art market intelligence at the hand, so that you actually know what is happening outside in the market.
[03:17] Not only in the market you directly perceive for your own RFPs and tenders, but also what is happening in the overall market in other industries ‑‑ the short‑term business, long‑term business ‑‑ depending on where you're active, yourself. This is exactly the fields where we are working on.
[03:37] As a quick beginning, before we go into our deliverables, a quick overview on who we are, actually, and what we provide. In my case, first, I'll start with Xeneta, my company.
[03:48] We have the largest cloud‑based database of ocean freight rates in the world. Contracted ocean freight rates, I have to say, so they are all valid contracts between one shipper and a freight forwarder or an ocean carrier.
[04:03] We use this cloud‑based data in order to provide benchmarking and market intelligence database, so to reduce the lack of transparency in this highly volatile ocean freight market.
Florian: [04:20] Thank you, Michael. The foundation of TRANSPOREON, the DNA of TRANSPOREON is really the connectivity, making it easier to connect shippers and their carriers. Based off that connectivity, to provide value added services and improve the performance, reduce costs, and ensure end‑to‑end visibility. Thank you.
Michael: [04:49] Apart from these mission statements, I would like to give you a little bit of a brief background on where we are from or to whom you are talking to.
[04:58] Xeneta is a Norwegian company, being founded in 2012 by two former Kuehne + Nagel managers who had the conviction that there needs to be more transparency in the ocean freight market, and there needs to be a neutral, independent marketplace where everybody can gather ocean freight rate information.
[05:19] Nowadays, we have over 700 business customers worldwide. We serve over 2,000 users, and also we have now several times been awarded by different organizations, like Startup of the Year from Lloyd's List, when it comes to the ocean freight market in that context.
[05:40] In addition to that, to give you a little bit of ballpark figures, I have already told you that we are having the largest database of contracted ocean freight rates in the world. What does this mean concretely?
[05:52] It means that we have around 35 million contracted rates and that we achieve between 1 and 2 million new contracted rates every month, mostly from freight forwarders and from global ocean shippers, either shipping directly with ocean carriers or going through freight forwarders. So we've crowdsourced data from hundreds of our clients.
[06:22] We can receive global coverage and we can supply global coverage to our customers up to 160,000 port pairs worldwide. We nearly cover all of the global trades, even in the smallest of those port pairs.
[06:38] This is the most important thing. We are able to deliver this in a real time manner, meaning that you can access the market data and the marketplace at every minute with real time, live data. It's updated daily so that you always be ahead of the time and that you're actually up to date with the short‑term market.
[06:59] Last but not least, we are neutral. We are independent. We are financed by investors, but not at all related with the ocean freight industry in any way, so we really understand our self as anonymous and secure, of course.
[07:13] We are not sharing individual data, but, which is even more important, absolute and neutral freedom in the market. We serve shippers, freight forwarders, and ocean carriers all in the same rate.
Florian: [07:29] Great overview. I would like to give you a quick overview of TRANSPOREON. As I mentioned before, the foundation principle, the DNA of TRANSPOREON is really having this one‑stop shop connectivity between a shipper and the different trading partners and carriers.
[07:48] Today TRANSPOREON is connected to tens of thousands of carriers and VOCCs ‑‑ small‑, large‑, mid‑size companies. Through this connectivity we leverage the value‑added services.
[08:03] One particular module in the TRANSPOREON family is the TICONTRACT procurement platform, which we obviously go deeper into today in relation with Xeneta. This platform, similar to Xeneta, is working completely neutral.
[08:22] Same principle like Xeneta, we are not related to any 3PL or any carrier. It's a neutral platform. Through this neutrality we help our shipper customers to really achieve the best in class transportation procurement process and the best rate for their service that they are looking for.
[08:53] We are the experts in transportation procurement events as TICONTRACT, with over 9,000 hosted events in 2016, over US $6 billion in sourced transportation volume, and millions of data points that were part of those big events that our customers have performed on the platform.
[09:14] I'd say the unique part in TICONTRACT is probably, again, based off that neutral platform and connectivity. We help our shipper customers to connect to a global network of over 35,000 carriers and VOCCs ‑‑ small companies, freight forwarders, the entire range of transportation providers.
[09:38] We help our shipper customers and we help the carriers that are connected on our platform to match, to find the right provider and the right service at the right price via our platform.
[09:52] That's what makes us pretty unique, because we are not a 3PL. We are not a broker. We are neutral technology, and enabling that connectivity via our platform.
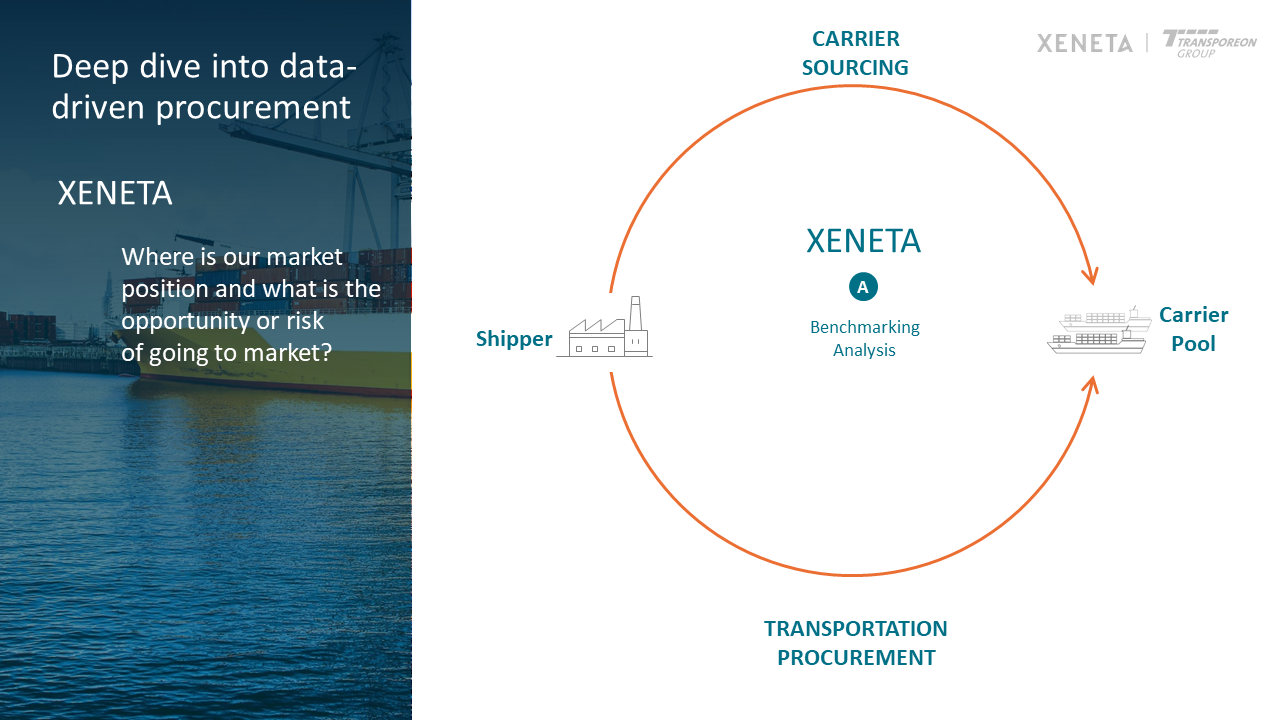
Michael: [10:08] We now would like to have a quick dive into the data‑driven procurement process, where we align our services ourselves.
[10:29] Starting about with it, at first we see a shipper or freight forwarder, that type, procuring himself. This company is then active on the market sourcing transportation businesses towards their carrier base.
[10:46] Now it already starts, because some of you may perhaps have never been in any kind of an RFP or tender process.
[10:53] You just have historical rate data lying there and you're questioning yourself if this rate data is still up to date, if you're actually following the market, or if you need to adjust anything. Or that you have recently tendered and you would like to understand how good your performance actually was.
[11:11] This is the first space where Xeneta can jump in, because we can help you to elaborate the opportunities or the risk of going out to the market, and then perhaps later on doing an RFP through TRANSPOREON.
[11:25] What we are offering to our customers is the so‑called benchmarking analysis. Within this benchmarking analysis we help our customers to define their own position in the market.
[11:40] This is important to understand, because you already get a picture from a market if you have recently tendered, but this isn't only with the carrier base you have approached directly and also the kind of rates where they have specifically offered to you.
[11:54] With us you get the possibility to review this kind of position, compare to 700 other large enterprises in the world, starting from a couple of hundred TEU, and going up to 300, 400 thousand TEU in this context.
[12:11] Our analysis is then providing an overview on your own spend, meaning that you get a complete transparency on your own network you have been providing to us, as well as, then, in this context, also a very, very clear picture on how much of this volume and budget we were actually able to benchmark.
[12:32] We are not going to sell any services where you are not having any transparency, which means that you get a clear indicator picture on how good the coverage was compared to the market information what we have.
[12:44] In case we are then able to give you a broad picture of the market, you will then be able to actually compare your own spend to the market low on the market average on a global level, as well as driven down on all of the kind of port pairs you have in the database. You really get, then, a drill‑down to all of the hundreds of thousands port pairs what you do have in your system.
[13:08] Then you can drill down, consolidate it on a regional level, or go down on a carrier level, and so on, so that you get an excellent preparation and evaluation of your current performance. In that way, for example, paving the way for later tender with TRANSPOREON.
Florian: [13:24] Excellent. I would like to take you now through this process on how TICONTRACT facilitates your procurement process, and then go over and show you how we then inject the data points from Xeneta and make meaningful analysis and information out of it.
[13:51] The first step, it starts, what I mentioned before, TICONTRACT will always onboard our shipper customers' incumbent group of carriers. We have a globally deployed network of carrier support staff that basically is able to help to onboard carriers in every region of our customers.
[14:16] We then allow our customers to look in the database. Look, as I mentioned before, "Is there the right match for my business?" Maybe I'm a midsized shipper, or maybe I'm a larger midsized shipper. Maybe I have a special type of commodity.
[14:30] What we help you to facilitate here is to find the right service provider for your service that you need. You can run this prequalification. It's quite a sophisticated process. You can qualify the carriers on the platform.
[14:45] What you do then, as a shipper, is you go in with the list of carriers or NVOCCs of all those who you think are the right fit to go into your bid process. What we then do is we create your bid matrix on our system.
[15:02] Michael showed us this quite complicated looking axis spreadsheet before, in one of his first slides. What we do is we build your bid matrix on our system online, with many, many advantages compared to sending out Excel spreadsheets to your carriers.
[15:20] I want to give you one quick example. In the ocean freight you are often looking, the shippers are looking not only for price, as we all know, but you're also looking for service components.
[15:31] Maybe you are asking your ocean carriers or forwarders for transit times. You're asking your ocean carriers for volume commitments. You're asking your ocean carriers for additional qualitative inputs, such as do you trans‑ship the shipment, or do you go direct, and things like that.
[15:48] In TICONTRACT we create those matrix that go beyond just the price point. That's very important in ocean freight. Then the shipper, you, we, open the bid end up to the carriers.
[16:07] The carriers can then online, on the TICONTRACT application, put their prices in. Or what often happens in global ocean freight scenarios is that the carriers download the bid sheet from TICONTRACT, work the bid sheet with their global pricing groups that they have, if we talk about the global ocean bid.
[16:29] Then they can work those pricing points and the qualitative points into the sheet offline, and then they can upload it towards the end of the process, as I said, with a lot of advantages attached to that.
[16:43] Because then the TICONTRACT system, once the bid is built and the shipper has put the parameters in the system, the system becomes very rigid in regards to what it accepts from the carriers and what it doesn't accept.
[16:55] That's going to be a very important element for the next step, which is you would like to do an apples to apples analysis. You would like to crunch the numbers, and you would like to compare the different offers that you have received from the carriers in the system.
[17:13] We will also show you how we can then use the Xeneta data points in the different analysis and scenarios that you can then create for your business, where you then allocate or you simulate, "OK, this is how I would like to allocate my business."
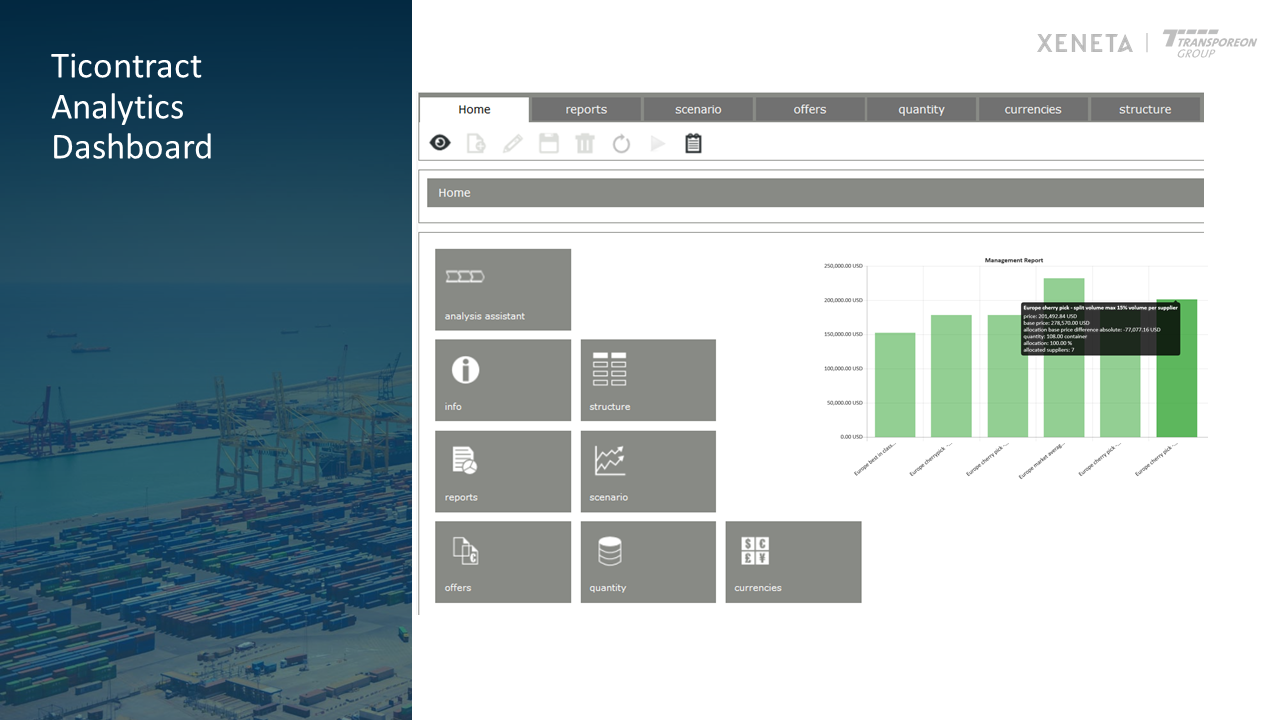
[17:31] Next step here, what we see here is now a snapshot of the TICONTRACT analysis dashboard. What you see here, this is a real example from our system. Neutralized the name of the carriers here.
[17:45] Where you see the carrier offer 1 to 11. Those are the real carriers who submitted their offers on this bid via TICONTRACT.
[17:52] You see this orange color‑coded base price. This is the historical data from the customer, the historical price points that the customer has provided when we create the bid matrix. You see this best in class Xeneta data point. You see this market average Xeneta data point.
[18:09] Those two data points, best in class and market average, basically are being now treated in our analysis module as if they would be offers from other carriers. What we will see is how we can now treat those price points in comparison to the offers in our own baseline in the next steps that we going to go through here.
[18:36] This is just a quick view onto the analysis dashboard in TICONTRACT again. We will now go a little bit deeper into a scenario comparison I have prepared on this bid example I have prepared together with the shipper customer, different scenarios now. I quickly would like to go over those.
[18:57] What you can see on top is the different scenarios where they are color coded in blue. What we can see that's highlighted with the black frame here is what kind of impact do those different scenarios have compared to my baseline pricing to base price, my historical pricing that I had maybe from last year or whenever I negotiated my freight rates the last time with my carriers?
[19:26] What you can see on the first left side is the deck Xeneta best in class basically data point would mean if we would be able to allocate business in this case to the price point that Xeneta or to the carrier where those Xeneta price points come from, we could save in theory 45 percent of our baseline price, which is of course quite a dramatic number.
[19:57] As you all know, in ocean freight, we have a lot of volatility. In this example, those are the real numbers from this real example.
[20:05] What we then created is other comparison scenarios. That's one of the beauties of the TICONTRACT tool that you can run different scenarios that reflect the business needs or the business constraints that you have in your real business. Very quickly, the next one, I just said to the system, "Please run a scenario where we would always take the best offer on an OD pair level, on a lane level."
[20:33] The result would be we would allocate to two carriers. We would split the volume against two very price aggressive or price competitive carriers. We could then save 35 percent compared to our baseline, which is obviously less than the best in class. Then I started to create additional scenarios where I said, "OK, split the volume amongst four suppliers." That's the one in the middle there.
[20:58] Then I started to put scenarios in that take into consideration volume restrictions or you could also say risk mitigation. What we often see from our shipper customers is of course they don't want to put all their eggs in one basket so to speak.
[21:17] They want to split their volumes and say, "OK, I'm going to put here a scenario in. I would like to give the carriers a maximum of 25 percent of the total volume." That's that scenario where you see four carriers, 25 percent. The savings are slightly reduced.
[21:34] Then the next to the last scenario, I said, "Give a maximum of 15 percent of the entire volume to a single carrier." It would result in the volume being split among seven carriers. My savings case again going down because I start to split the risk. I start to split the volumes across the carriers.
[21:55] The last one on the very right side, I said, "What would be now if we allocated the business to the market average data points from Xeneta?" What's really in this example just looks very beautiful is that you have this...
[22:10] Very left hand side, you see the best in class. This would be if I take always the best price on the lane level. My savings are quite high. As I go to the right, I see the market average is still a saving. Basically, in this bid event, I can see this already from this high‑level point of view.
[22:30] I can see, in this bid event, my carriers gave me prices that are somewhere clustered around the market average and the best in class which, as a shipper customer, I could now say, "This is a pretty good result."
[22:45] Or I could say, "I see my carriers are really, um, um, very competitive in this bid, and I'm fine if I don't maybe have everywhere the best in class prices, but I know I am on a very competitive, I'm here in a very competitive bid event."
[23:02] I could talk much longer about the different scenarios. The main message here is no Excel spreadsheet in the world will be able to create you those type of the scenarios with many, many carriers with many, many price points. It would take you a long, long, long time to create this.
[23:21] In our system, those scenarios, system calculates it once you set the restraints, 5 to 10 seconds, those scenarios are there.
[23:38] In this example now, you see a drill down into a very single price point. Just wanted to give the audience the idea now from this more aggregated level that we were before with those scenarios that we created here. You see now that the deep dive onto one price point onto OD pair, in this case for Ningbo, China to Antwerp, here the best in class Xeneta price point, this case, it was a 20 foot container, 847.
[24:10] Then you see the actual offers from the carriers, how they nicely cluster, how they come in right between the very competitive point, best in class, towards the market average. Then you have a couple of carriers that were below that price point or above the price point in this case. Then you see how my base price fares against that.
[24:35] There's a lot of information in that. If you're now an educated shipper, if you now going into the next level, you can really take this now, discuss potentially with your logistics operations team.
[24:48] Maybe your logistics operation team says, "Yes, we would like to go here with carrier four because they give us the best service and the best, um, whatever, transit time," and whatever other topics there are that your operations team needs.
[25:05] You could tweak those scenarios now and rerun them. You would see then the impact of those changes maybe that your operations team gave you as an input. You can also challenge basically your internal customer if you will.
[25:20] You could challenge them and say, "OK, um, um, there, the price point of your preferred vendor is really very much, uh, not, not really competitive, and how can we, how can we work something here that works on an operational level, that you have the right quality of the service but also the right price?"
[25:42] With that, we go out of the deep dive here again towards the overview.
[25:51] Michael, if you could just go to the next slide.
[25:59] Here is now just the output. This is just the graphical reflection of those different scenarios that you saw before.
[26:08] Just also a nice feature in a TICONTRACT analysis dashboard that you can really get those analyses out in a graphical way, when you're in the live system and you hover over those different bars, you see it on the very right side, it shows you the details of that particular scenario.
[26:28] Of course, you could get additional KPIs and parameters of each of those different scenarios out of the system, the volume splits and so on, and work with, again, with your internal stakeholders as well to give them feedback on the total bid result.
[26:47] We often get the request when we work with our shipper customers, "Well, how can I now report, um, the success of my RFP to my management? Um, how can I discuss the, the detailed, more granular results with my operations team who of course I need buy‑in from? They need to execute against the rates I negotiated here."
[27:10] The dashboard and the tool really provides you the visibility to show your internal team as well what did you achieve at this bid, how did you get there, and maybe what do some changes on my allocations mean? What kind of impact do those changes have in regards to potential savings or cost avoidances?
[27:37] That was the run‑through in regards to how we would analyze, how we would use the Xeneta data points really in TICONTRACT during a bid event. Michael, if you go to the next slide...
Michael: [27:53] Now I just go back. Thanks very much for that, Florian.
[27:58] It actually is all as you already mentioned our name here. It's perfect tool for us in order to show how important market intelligence is because you have now shown with your TRANSPOREON tool how great you can produce a visibility throughout all of the bids in your tender at the one side at a global level. On the other side, drill down to the specific port pair and, yes, devour market information.
[28:21] We can just enhance this kind of analysis in the level that you can not only get a transparency over your own bidding field but also how this is lying inside of the market, which means how far are you away from the best bids?
[28:35] How far are you away from the market average? Because this also gives you very, very valuable information if you want to push further down because you really want to negotiate the best prices possible.
[28:46] Or if you get some kind of argumentation that we are lying quite well in the field, we are looking for service related issues as well in want to have a lot of stability inside of our portfolio. Then you can orientate more, for example, towards the market average.
[29:01] Still you can make sure that you're not falling out completely with your own regulations and with your own necessities compared to the rest of the shippers within the markets.
[29:12] This is this kind of outside view, what we always recommend our customers, so that you can just see a little bit beyond your own horizon and that you can see and adjust your own strategy towards what is happening in the overall market where you active on.
[29:28] Thanks very much for that presentation, Florian.
[29:31] On top of that, now going specifically inside of the Xeneta tool, one third thing, what we are able to deliver, this is of course something which would then overwhelm a little bit the analysis of the pure tender or the latest market trends which are of course especially important when it comes to getting an idea on where the market is going.
[29:57] What are the trends being there? How do the capacities look like? What is the overall situation? Because these of course has especially an impact when it comes to the different negotiations round, from one round to the other.
[30:09] For this thing, I have now prepared a quick introduction in our web‑based tool so that we can actually jump into the platform for a minute because here now we are really looking at real time data. That will be just a little bit too complicated to actually put out only in screenshots.
[30:29] I'm not just jumping over into our platform. Let me see. We'll take a short, quick second. Then we should be back with the picture. Let me see. Just a sec. Are we seeing the market picture yet? No?
Florian: [31:08] Not yet, Michael. Yeah, now we can see it.
Michael: [31:14] Now we are perfect. This is now, for example, one specific market. A little bit more high‑level, but we could also drill down to the port pair. We are now looking, as we have a lot of people from the US taking part today.
[31:27] As we know, the Trans‑Pacific market is one of the ones where there are happening a couple of things at the moment. I have not taken this specific market picture. What we are seeing here is actually the development of the Trans‑Pacific trade, eastbound, from China, east to the North American Pacific West Coast, throughout the last three years.
[31:48] You see here two different graphs. The first one, the orange one, with quite a lot of high volatility, is the short‑term market, while the blue one is the long‑term market, meaning all of the contracts which are at least three months or longer and mostly with a contracted period of one year.
[32:06] As you can already see over these two pictures, looking at the market trends, you could clearly see that the volatility of the short‑term and the short‑term in general is driving the happenings on the long‑term market.
[32:18] For example, towards the end of 2015, '16, we had quite a favorable situation on the short‑term market, on the Trans‑Pacific. This was then also caught up by the tender situation after the TPM in the spring 2016 while now, through the last couple of months, it was the opposite around.
[32:38] The market recovered very much. We had quite a peak at the beginning of 2017, which then actually collapsed around the TPM time. They couldn't hold it up on that level. The previous general rate increases which happened were not really successful.
[32:53] They were more or less diminished, which then led to the fact that the long‑term market did not react that much over the last couple of months. We had a quite stable market development throughout the last 12 months. Now, this is exactly the point where we come in with our market trend information.
[33:11] When we now look at this situation within the last couple of weeks, assuming you are a shipper with things going out to tender, on the Trans‑Pacific or you just would like to get the latest information for your negotiations, you can then see that there has been some kind of trials to actually improve the market level on the short‑term market by general rate increases within the last couple of months, with the latest one coming in at the beginning now of November.
[33:41] You probably have heard that one already in the specific press. As you can see, so far all of the general rate increases have more or less diminished again. We already recognize again that the short‑term market is diminishing again, at least with today's date.
[33:58] Here we can see this is really the 7th of November. We do have a short‑term market level of around 1,718 since then, around 1,700 on the short‑term market. With the long‑term market, we still stay around the same stable level, which we had for the last couple of months, around $1,500 US.
[34:19] So far, the latest market information, we would say that the market remains stable and that the short‑term TRIs have not yet been successful. This is exactly the kind of thing that we can offer to our clients.
[34:34] Through the licensing of the Xeneta app, they are able to follow up these short‑term developments, so that they are actually able to see how is the market behaving and what kind of market situation should I expect with my upcoming tender negotiations.
[34:52] For example, in a situation like that, where you see that, over months, the short‑term market has been significantly below the long‑term market, well then, this gives you already the goal for your negotiations.
[35:03] While, the other way around, in such a market environment, if this is now going to happen within the next weeks, then you would be already extremely satisfied if you could hold the rate levels of the past year and not accept any kind of rate increases, especially if there would be any kind of general rate increase coming into the picture, like we saw, for example, at the beginning of January last year.
[35:26] As I said, so far, we don't see it there. This kind of latest information we provide to our shippers on a daily basis. As you can see here now in our example, it's now into the 7th of November or 8th of November. It's really according to the latest one.
[35:43] They get this kind of information. This is, of course, giving you even better a trend information and a better indication on what to expect in your rate negotiations. But that's not the only thing that we can offer.
[35:57] You get, on all of the different regions, in all of the different packages you could now go on Asia to Europe, Europe to Asia, whatever kind of market you are looking for. We are happy to do individual sessions. The other thing that we can offer is, going back to the benchmark, also to track your performance over time.
[36:17] Here you see again the similar market development of the short‑term market on the Trans‑Pacific. What I have now displayed is, incase you book our analytics mode, which means that you provide us with your rate levels and volumes, we are then also able to display these kinds of different contracts, even the tender offers if you like, inside of our market picture.
[36:40] You get a very good evaluation on how far you have been inside of the market or you have been off at a certain point. For example, looking at the situation here, with the two contracted offers in place, you can see that, with the upper one, you were above the market.
[36:56] With the lower one, you have been exactly on the market level. But then, due to the upcoming uprise of the market, you have been confronted with an increase in market levels now at the beginning of March this year.
[37:09] With this kind of comparison to the market graph, you would just be able to justify these things. You would see that, with your lowest bids, you have been again down on the market at average. So quite a good solution there.
[37:22] With your second offer you had to accept for any kind of reason, you were again significantly higher than the market average at the start of the tender day. This is a force giving you also very, very valuable input for internal talks with, for example, your business unit, when it comes to the justification of a specific carrier selection or when it comes to a justification of any kind of service requirements, which then led to this kind of carrier selection.
[37:50] Xeneta doesn't only give you market trend information. You can also use it for a reward looking evaluation of your previous performance, even going back, as you can see, on this screen, if you provide us the rates for the last three years, even going back, for example, for the last three tender rounds in this context.
[38:11] There are a couple of things where we can mirror your own performance against the market picture. That's pretty much it. In that way, just as a thing, not only the average but, of course, also market low and market high.
[38:25] You can really get all of the corridor within the market to evaluate your own performance. That was just a quick snapshot also from our one. Now I'm just trying to move back again to the presentation, so that we can go on with the details there. Now we should be back.
Florian: [39:01] Yes.
Michael: [39:01] Yeah. Good. That was it from my side, when it comes to the comparison of the latest market trends. I would like to pass over to Florian again, when it comes to the allocation of the volumes after you have done all of these kinds of sophisticated analyses.
Florian: [39:19] Yeah. Great. Thank you, Michael. The last step now would be that you have communicated the different scenarios, how to allocate the business. You have communicated this certainly to your internal stakeholders.
[39:38] Potentially, you have used the capabilities of TICONTRACT to run this via several rounds in the system. There are quite sophisticated possibilities for you to even give your market, the carriers, the participants a live feedback via the platform that gives them a color‑coded feedback on their price on certain lanes, for instance.
[40:01] That's, again, your way how you procure. This should be your strategy. TICONTRACT then takes your strategy and helps you to execute against it, in regards to the tool and the possibilities that are on the tool.
[40:16] Then, once you have done that, once you have done the analysis, massaged the data so to speak, you can then get all the results out of the system in a format that you would then take and have ready to, for instance, upload into your TMS system or hand it over to your freight payment company or use it in your own ERP system or load it onto the rate management system that TICONTRACT also provides.
[40:50] The data that you generate ends with the step where you hand over the allocation packages to your carriers. You confirm what you saw in one of those scenarios before. These are the lanes with the volumes that I would like to confirm on my contract with you, as a carrier.
[41:11] You then, as I said, take those data points, put them into your in‑house systems for your execution process, for your day‑to‑day shipping of those containers. You have it all in one place and all sorted out. That's really the last step in the TICONTRACT process, in the procurement part of the process. With that, we have gone through this entire process from the beginning to the end. Michael, back to you.
Michael: [41:41] The last point I would like to put on top is that, similar to TRANSPOREON's export possibilities, we also have a possibility to performance reporting, which means that our clients have the possibility to take on any of the KPIs. They have learned to also present it to their management.
[42:03] We think this is especially very important, when it comes to the calculations of savings. In the case of TICONTRACT, you have a powerful tool to go through your tender, to run all of these analyses and to, for example, calculate your savings compared to the scenario of your previous tender and to your current allocation and so on.
[42:26] The challenge you then always have is what are you doing in an uprising market. What are you doing when your new allocation is actually lying 20 percent above the previous bids, just due to the fact that the overall market situation was like this?
[42:40] Your CFO or your CPO still requires you to document any kind of savings that you achieved throughout your negotiation. In that way, it is also very powerful to have the Xeneta market data.
[42:55] By comparing it to these kinds of market trends, similar to what I just showed you on our live platform, you would be able to actually achieve these kinds of saving calculations and actually prove that you could perform better than the overall market development, throughout the time of your tender.
[43:14] In that way, show the kind of savings and improvement you could perceive. That would have been it also then from my side. Going into it, showing you the details, showing you how we, Xeneta and TRANSPOREON, supply data‑driven market intelligence and processes for the ocean freight procurement.
[43:35] To sum up our day now today, we would just like to consolidate all of our things again on one slide and give you a summary to what you would expect by working together with us. From our side, from Xeneta, it is really all this kind of market relevance and market data.
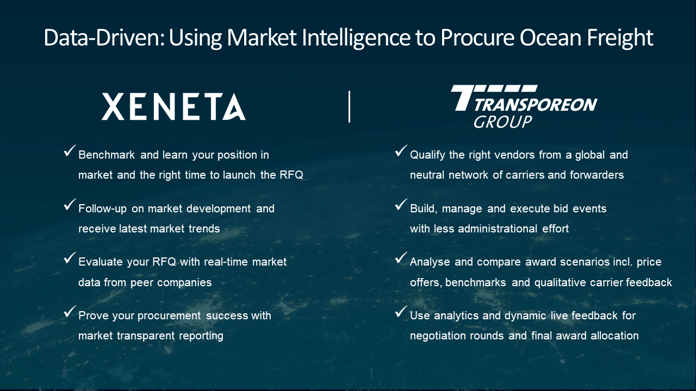
[43:54] With Xeneta you will be able to state and achieve your position within the overall global market to get the perfect preparation for an RFQ. You will be able to follow up the recent market developments and get all of the necessary information about the latest market trends, so that you are in the best able position to manage the incoming bids and prepare your negotiations.
[44:19] Then, at the end, also get a transparent and individual and independent overview on how you performed, compared to the overall market. Summed up with two words, it's just market transparency.
Florian: [44:35] Yeah, excellent. The contribution of TRANSPOREON in this equation is, as I pointed out before, you have the possibility to really find the right partner for your freight, for your business. We are tapping into this database. It's a pretty unique feature.
[44:59] It's a real marketplace. It's a real place, where you can get the right partner for your specific freight. You then build, manage and execute bid events with less administrational effort, less time that you need to communicate back and forth between you and your carriers, because one carrier has done the bid sheet in one way.
[45:20] The next carrier has forgotten to fill out this. You can communicate all your requirements, via the tool. You communicate via the tool, during the bid event. You save a lot of time. It stays all within the system. That's extremely important for our customers, who really have very specific auditing rules.
[45:44] They need to be able to really track everything that happens in a bid event. The analysis and comparing of the scenarios is an absolute highlight that we can bring to the table. Again, Excel spreadsheets are the standard tool everybody uses today. That's good.
[46:03] That was a good innovation, back when Bill Gates and his company brought Excel out. It was a good innovation. But Excel alone can't do this. Excel alone can't create you those complex award scenarios, where you would like to put in constraints in your awards.
[46:24] That's just not possible with Excel. Here, again, TICONTRACT brings that specific intelligence into the game. The live feedback to the carriers is the last thing that I want to mention, the dynamic in this process.
[46:40] By the way, when I speak to our shipper customers and their carriers, both sides appreciate that. The carriers like to receive feedback during those bid rounds, to know where are they in the process. On the other side, our shippers have way less effort with giving this feedback to the carriers.
[46:59] It's really the end‑to‑end process from the beginning, setting up the bid to having your ready allocation file ready for your TMS system.

Questions & Answers
Q&A conducted between the time period 47:00 to 59:00
Q1) Does Xeneta offer spot data as well as long‑term freight agreements? Which data is used for the implementation in TI contracts? Or is it an export of the total database, especially in RFQ processes, only latest agreed prices will give the better market picture?
A1- Michael) This is actually a very good point. The market data, what we feed into the individual tender, can be applied or it can be customized towards the specific need of the client. If you are really a freight forwarder and you're doing a short‑term market tender, then, of course, you would feed in the corresponding short‑term market data. While somebody, who is more on the long‑term market, with three‑month or one‑year contracts, he would be more looking for the long‑term data. Then we would only feed that one in.
Even on the long‑term data, we do have different things. We, on the one side, have all long‑term data, meaning that it's currently valid. But it could have been already tendered, I don't know, 6, or 8, or 10 months ago. Some customers still require it like this. Other customers only would like to have, and we do have this as a specific market. It means that it's long‑term data, with 3 to 12‑month contracts. It's only recently tendered within the last three months.
Really only recent market data coming in, which has been tendered throughout the last 90 days. That would be then also a different market average that we could feed into the TRANSPOREON tender. There are all kinds of possibilities done, down to the port pair, more on a regional level. This depends on how the customer wants to have it.
Q2) What is the entry level? How large do I have to be as a shipper here to use this approach and this system?
A2 – Florian) The audience or the participant here asks how many TEU do I have to have per year. I would like to answer it more the way we look at it, from TICONTRACT side. Usually we take a look at your freight spend. That's also normally our model.
We start, in this regard, with customers for the ocean freight spend who probably have a spend somewhere around five up to 10 million as an entry‑level in US dollar annual freight spend. That goes very much with, we had a lot of success with customers that, of course, are large customers.
We also had success with customers in this entry‑level area. For those customers often, for those shippers, it's often extremely important to really find the right partner. As you may be our small or midsize shipper, maybe you are also looking for a smaller or midsize type of follower, who is maybe a better fit for your business than some of the largest companies in the world and vice‑versa. I'd say, to answer the question, the entry level here I see between 5 and 10 million in annual freight spend.
Q3) Your market rates, is the market average based on a similar commodity to ours? Supposedly a shipper customer here asked what is the linkage to what is actually the content of the containers we are benchmarking? Can you comment on that?
A3 - Michael) One clear thing, there was also another question when I came to reefer containers and hazmat. We definitely only compare apples with apples when it comes to the equipment side. The dry container market we access here is only limited to dry containers.
In case there are additional surcharges paid for dangerous goods, then we deduct these ones. We have all of the market knowledge and how much these additional surcharges are or, in most of the cases, they are also specifically stated by the customers. They will be deducted. They will be calculated. Also, that we only talk about the standard dry prices while, for example, we do have reefer rates in our database, they are completely handled differently.
We show them and we display them in an individual own reefer market. The coverage is not as good as on the dry markets. Though we can't offer 160,000 port fares on the reefer side, but it's still good enough to have quite good global coverage when it comes to reefer rates.
We are happy to conduct a value assessment also for reefer to prove here that we can lay back your network in this context. When it comes to the market picture itself, it states the overall markets. Yes, the best bid is then really a cherry‑picking thing, probably not the very best service available off the market. Still, it's been on the same service because it's a commodity service on the ocean freight.
We put then all of the offers in one basket. There is no differentiation between direct or indirect services, or when it comes to any specialties. Perhaps one or the other shipper has with demurrage and detention and so on.
Here we really display the overall market as a whole. We display the range of this overall market with the market low and the market high. While the average then will, as the name says, stays more or less the median, where the overall situation happens in this context.
Perhaps another question, which also came up here, is how we are coming up before with the size of the customers? For us, it's a little bit similar. While we do even have some customers, which are below 1,000 TU ‑‑ not that much.
When you think of that you are, yes, have a budget of a million of freight some, and you do have a gap of 20 percent, then it's still absolutely valuable to go after these $200,000.
In this context, most of the shippers are very similar to the range TRANSPOREON stated, but we even have one or the other one which is smaller. If there is a lot of money behind, then there is, of course, a definite return of investment. I think same applies for TRANSPOREON as well in this context.
Q4) How you match the freight costs from your customers with the lead time or transit time of the carrier in TICONTRACT?
A4 – Florian) Absolutely great question, especially in ocean freight. Yes, the short answer is our analytics tool has the capability to take both into consideration. In the first iteration of the analysis, you probably want to do it based on cost.
Then you can also allow in our solo tool to basically add now the transit time into this equation, and then see based on that how your maybe savings case changes if you all of a sudden say, "OK, transit time is more important to me than just costs.
I will see right away in my analysis comparison what is the impact of that maybe more favorable or faster service compared to the lowest cost offer."
Yes, that's absolutely possible. The key here is ‑‑ and that's my final remark on that question ‑‑ that you, of course, collect those data points in your bid matrix, which I mentioned before. You collect not only price, but you collect service parameters as well in your bit matrix. Then we can again analyze every data point that you collect, such as transit time as well.
Q5) Are we also able to do the performance reporting on actual spend and actual allocation?
A5 – Michael) Yes, we are, because we are able to compare your budget with our market data. Which means that if you give us actual rates and actual volumes ‑‑ not the planned ones from your allocation from the tenure, but really the actual ones recently happening ‑‑ we are in the same way able to actually put that one into our platform.
Then you are also able to compare your current spend, with probably the plan spend, as well as with the overall average spend you would have when you go for the average carriers in our market database. There are also possibilities to actually track the actual spend of the market.
Q6) Are the merchant attention‑free time, transit times, and other topics considered in the market average, or how do you ensure comparing apples with apples here?
A6 – Michael) We do have a specific rate management team, just to give you a ballpark figure, out of our total strength of 60 people, we have alone 15 people who are just taking care of the data input. We have a specialized team sitting in Norway.
This is not at all a task that we have outsourced to data providers, but this is really one of our core competencies we have in‑house, is to make sure that all of the data we are access is really understood in the right way.
Openly speaking, I would say 95 percent of our customers learn something through us when it comes to data transparency and the understanding of their surcharges. We absolutely make sure that we count in all of the surcharges which really belong to the standardized transportation processes, no matter if any of the freight forward or service provider probably splits it in 15 different surcharges or whatever.
At the same time, we of course take out everything which is not related to the standard process. Meaning, for example, for hazardous goods, for example, for merchant detention or any kind of insurance costs and so on. Therefore, we do have a sophisticated rate management team really taking care of that.
You can be sure, as we also work with freight forwarders, which are sometimes having hundreds of thousands of TEUs to be handled, yes, we are really absolute experts in drilling that down so that everybody can be sure that we really compare apples with apples. Hopefully, then giving you the best information possible for the future market trends and development.
Anca: [59:17] I hope everyone who joined got more information on how to get the competitive rates and mitigate risk this bidding season.
[59:32] At the same time, an idea on the type of information intelligence Xeneta and TRANSPOREON Group provide for ocean freight or RFQ process. We'll get back to you and answer any questions that we don't get to today.
[59:49] If you have any additional questions, or you like to receive more information from us, please contact us by replying to the recording email, which will be sent to tomorrow. That's it for now. Thank you for joining us.
###
If you missed any our webinars – or simply want to refresh your memory – you can access all of them on demand here.
See you next time!


