
The year-on-year growth of US inbound air cargo tonnage has been falling for 12 consecutive months since June last year, nearly wiping out all the pandemic growth in volumes.
Asia leads the contraction of US air import volumes
According to the US Census Bureau, inbound air volumes to the US fell by 14% in May compared with the same month in 2022. However, volumes were 4% higher than the pre-pandemic level seen in May 2019. This contrasts with April this year, when volumes were down by 0.3% compared with April 2019. The biggest year-on-year drop in US inbound air volumes is still the 18% fall registered in December 2022 compared with December 2021.
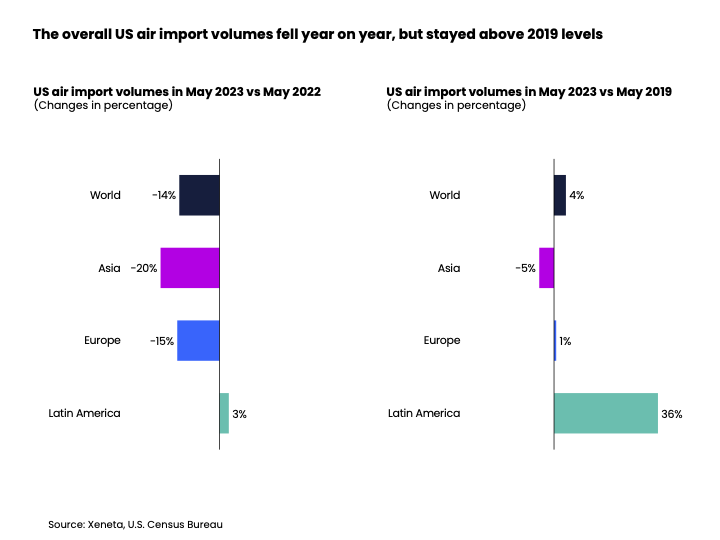
Zooming in to the corridor level it is clear US air imports from Asia have been hit especially hard this year. Asia is the biggest source of US air imports and volumes were down by 20% in May compared with the same month last year. This trade showed early signs of weakness last year as volumes started to decline in April 2022, two months earlier than the general fall in the trend for US import volumes.
Volumes from China to the US were down 21% year on year in May as geo-political tensions between the US and its biggest trading partner in Asia continued to drag on. Due to weak demand in the US, imports from Vietnam fell even further, registering a steep drop of 51% from a year ago.
Asia is the only major region that showed a contraction from the pre-pandemic period in US air import volumes in May this year as levels shrunk by 5% compared with the same pre-pandemic period in 2019. This figure has been mainly dragged down by a fall in imports from the Chinese market as May volumes from China showed a decline of 20% compared with the same month in 2019.
The second-largest source of imports to the US is the European market and volumes on this trade fell by 15% in May from a year earlier. The first month of declining volumes on this trade was in December 2022, much later than when volumes from Asia started to fall. It seems that unlike volumes from Asia, US air import volumes from Europe have still to bottom out. May volumes from Europe to the US remained 1% above the pre-pandemic level.
In contrast to outbound Asia and Europe, the ex-South America market showed growth this year. Since single digit declines between June and September 2022, volumes on this trade have been growing year on year. Export volumes in May grew 3% from a year earlier and were up by a significant 36% when compared with the same pre-pandemic period in May 2019.
Falling share of US imports come by air
The fall in this year’s air cargo volumes into the US is partially attributed to a softened retail market, although it is still growing year on year. US retail sales only increased by 0.6% in June from a year ago, and down from 2.3% growth in May. Importantly, this is measured in value and therefore when adjusted for inflation the volume of retail sales fell in June.
As well as slowing retail sales, lower US air imports can be attributed to a falling share of US imports coming by air. In the first five months of this year, the share of air customs value from the total US imports (including both air and ocean containerized customs value) fell from 49% in the same period of 2020 to 45%, a similar level as the same period in the pre-pandemic 2019. It is worth noting that air imports only account for about 3% of total US air and ocean containerized import volumes.
The decline in air customs value is partially influenced by improvements to ocean schedule reliability since the second half of last year. As a result, air shipments are contributing less to the growth of US retail sales as shippers are increasingly avoiding expensive air freight.
Want to Learn More?
Watch the latest episode of our monthly State of the Market Webinar for air freight rates to see where you stand in the volatile markets. If you have any questions, please send them to info@xeneta.com.