The air freight rates in Europe to the US market have been trending downward for both the spot and long-term markets.
The spot and long-term rates have been moving at similar levels for the past three to four months. As inflation negatively impacts consumer savings, we continue to see downward pressure on air cargo rates.
Watch the latest 'State of the Air freight Market' webinar, where Niall van de Wouw, Chief Air Freight Officer at Xeneta, and Wenwen Zhang, Air Freight Analyst at Xeneta, discussed how air freight markets performed in January 2023 and which lanes are experiencing the maximum impact on rates amidst global disruptions.
Key webinar insights
- Which lanes are experiencing the most disruptions + impact on rates
- Demand to supply ratio - is it still in the negative?
- Spot & long-term freight rates on top global trade lanes
- Spotlight on Transatlantic market & lanes
Market development so far...
Global air cargo volume year-on-year continued to drop in January 2023 since February 2022, making the start of the year difficult for the airlines. On the other hand, freight buyers witnessed a recovery of more than 10% in the total global capacity compared to the last year: This is due to the return of the belly flights since March of last year. Xeneta data shows that global air cargo capacity is close to being at par with the pre- covid levels.
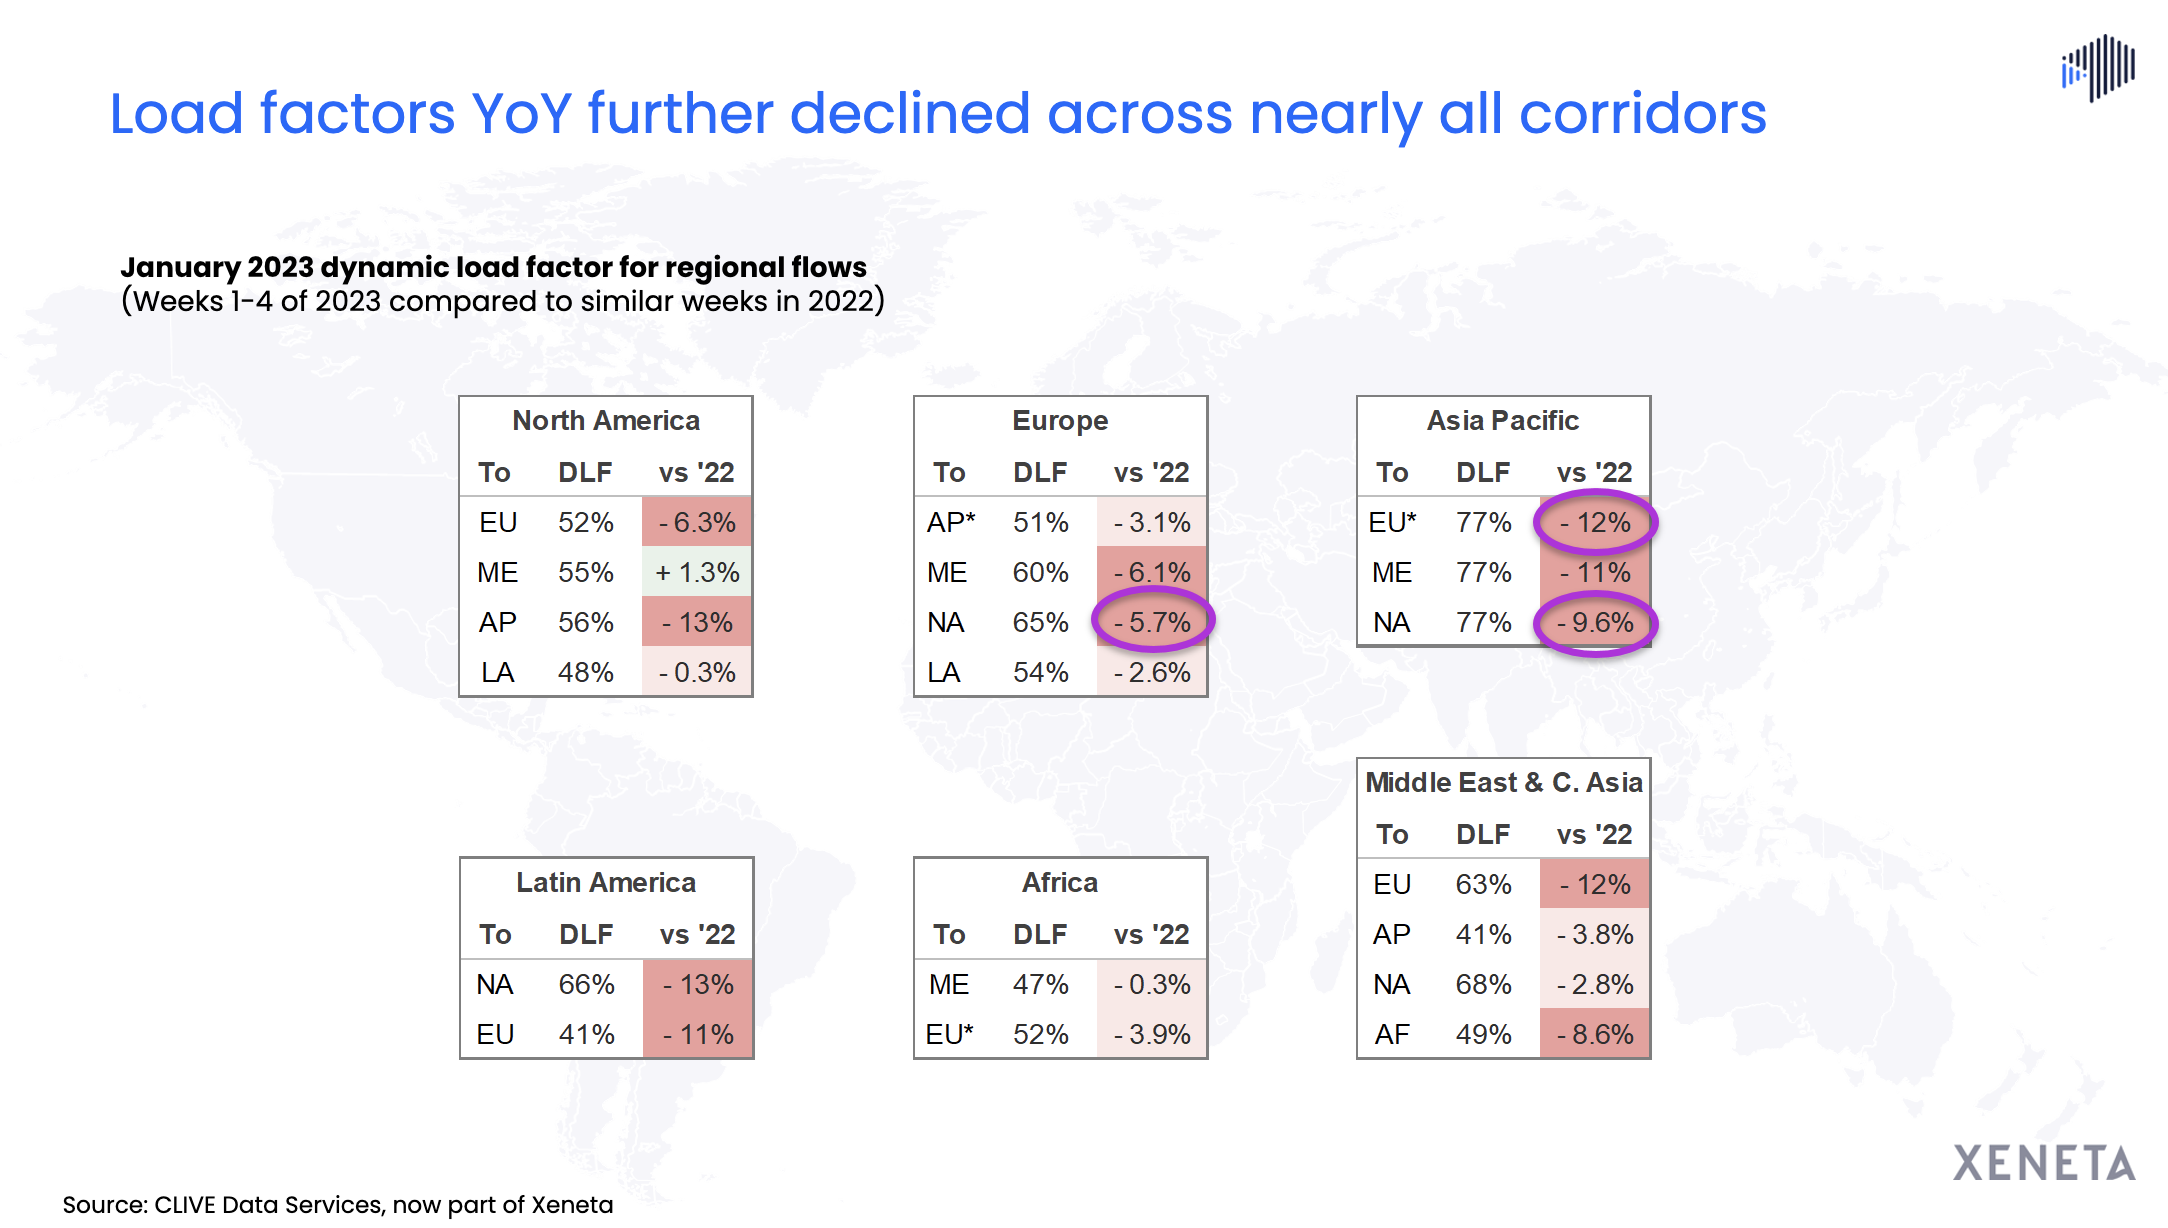
At the regional level, we see a lower load factor on nearly all major trades in Jan 2023 compared to last year. One of the biggest declines was seen on the Asia Pacific to Europe trade (- 12%). Asia Pacific has the same striking load factor of 77% on all three major corridors, APAC to Europe, the Middle East, and North America.

Europe to North America load factor is also lower, considering the excess capacity that entered across the Atlantic compared to last year. But the transatlantic market is more resilient than others, as air cargo volumes on this corridor stay buoyant.
The current double-digit decline in load factor across nearly all regions is putting downward pressure on air freight rates in general. Other than the Covid-19 aftermath, the air cargo market is also exposed to other external factors, including economic headwinds.

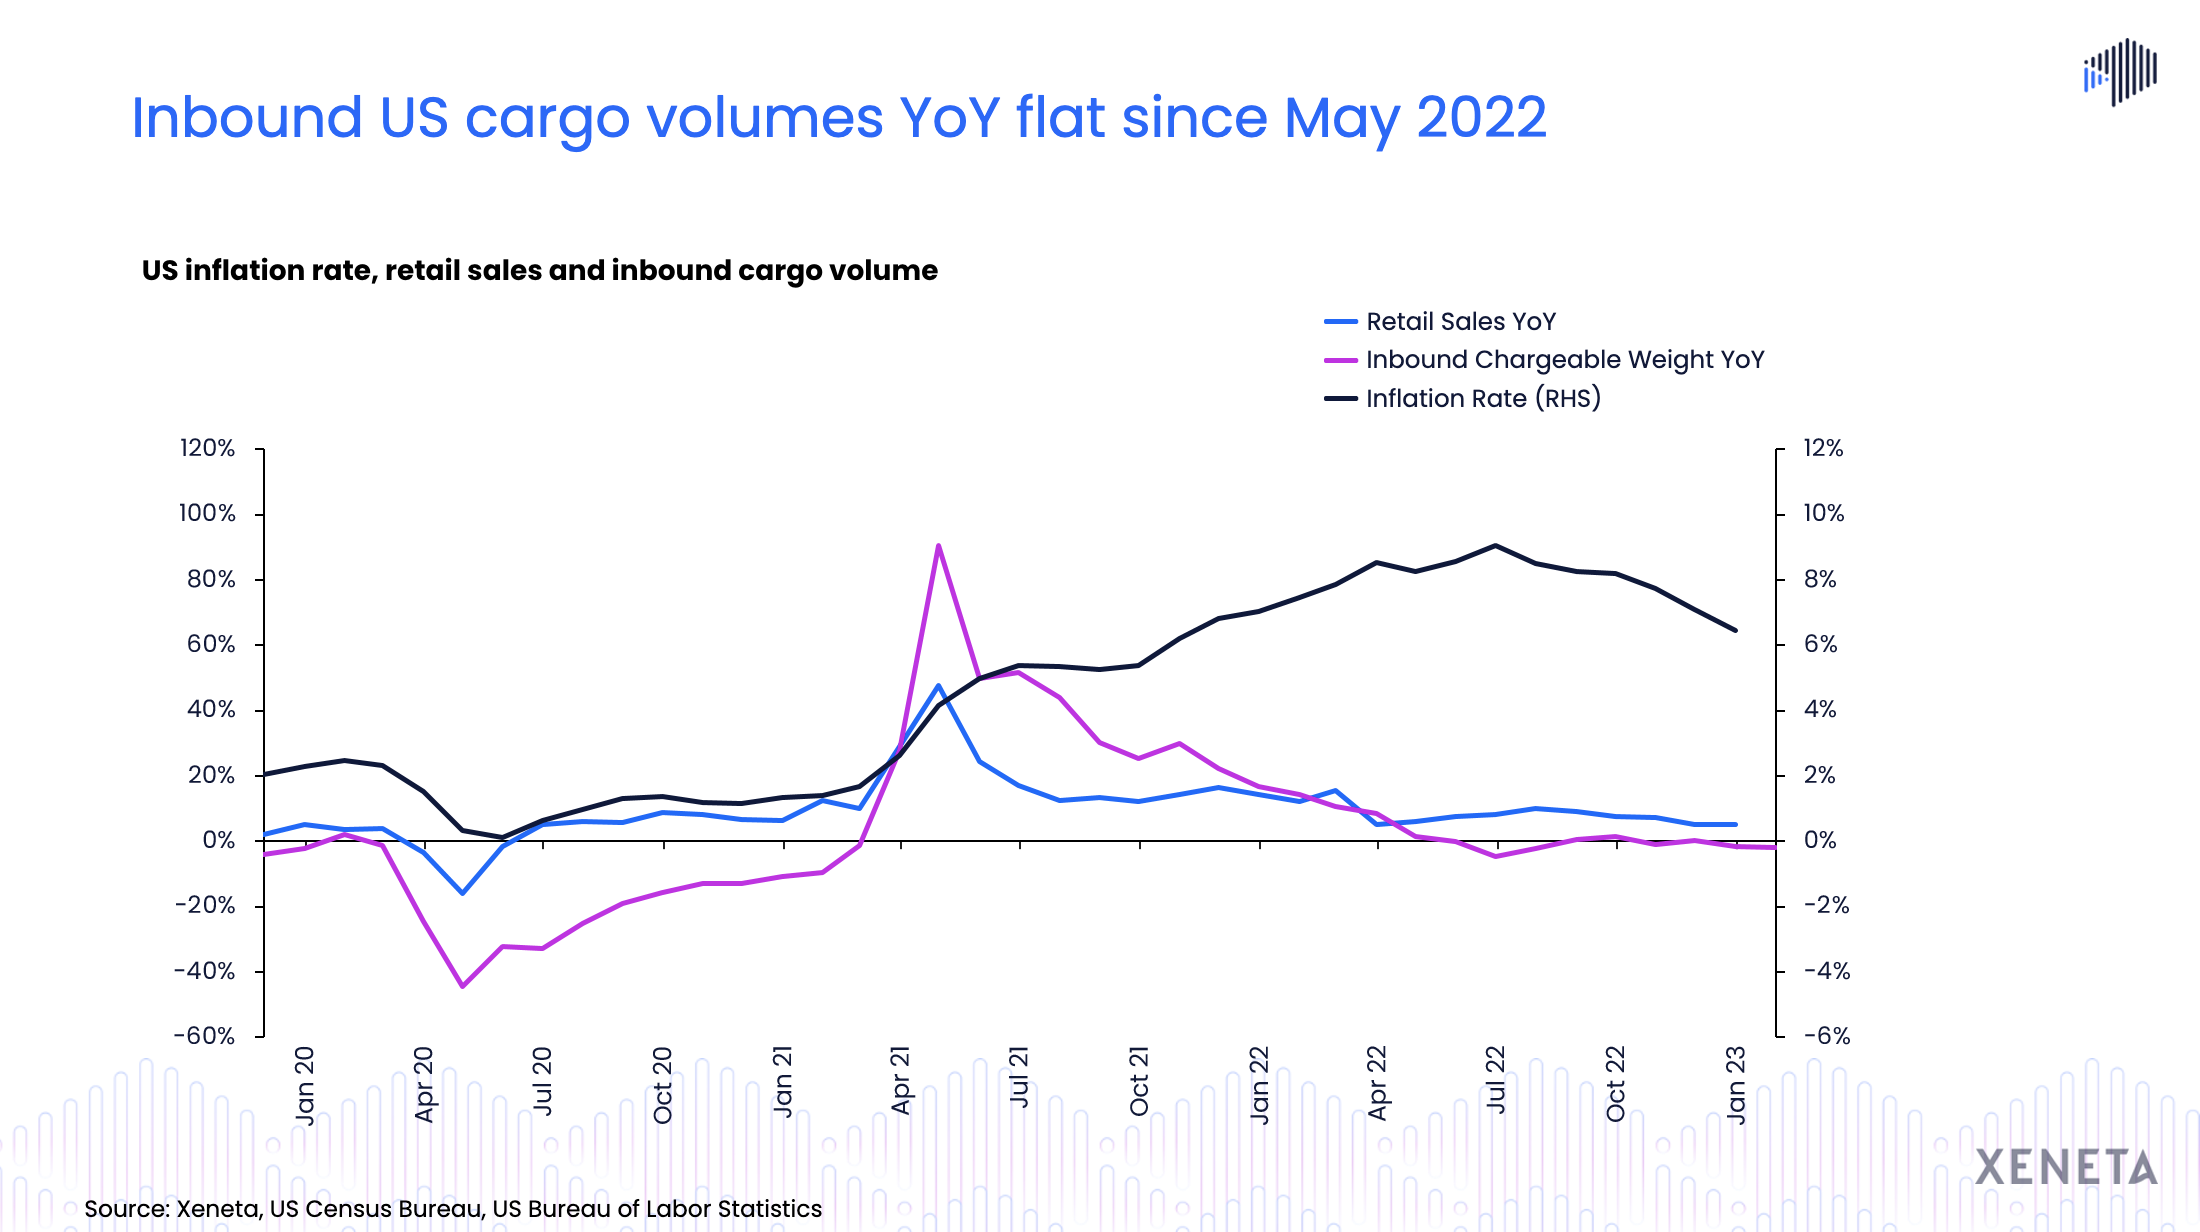
The US inflation has been above the target level for 21 consecutive months. Since it reached its peak in June last year, the January US inflation continues to trend downward. Although the growth has decelerated since July, the impact of inflation persists. The US retail sales slowed down since July last year, pushing the November inventory-to-sales ratio to its highest level in the last two years.
Historical data suggests that the air cargo market tends to be more sensitive to economic cycles than the general market. This is why the inbound US air cargo volume registered its first negative growth year in May 2022 and continued its negative trend for five out of the seven remaining months of the last year. In January 2023, the air cargo volume continued to fall 2% from a year ago.
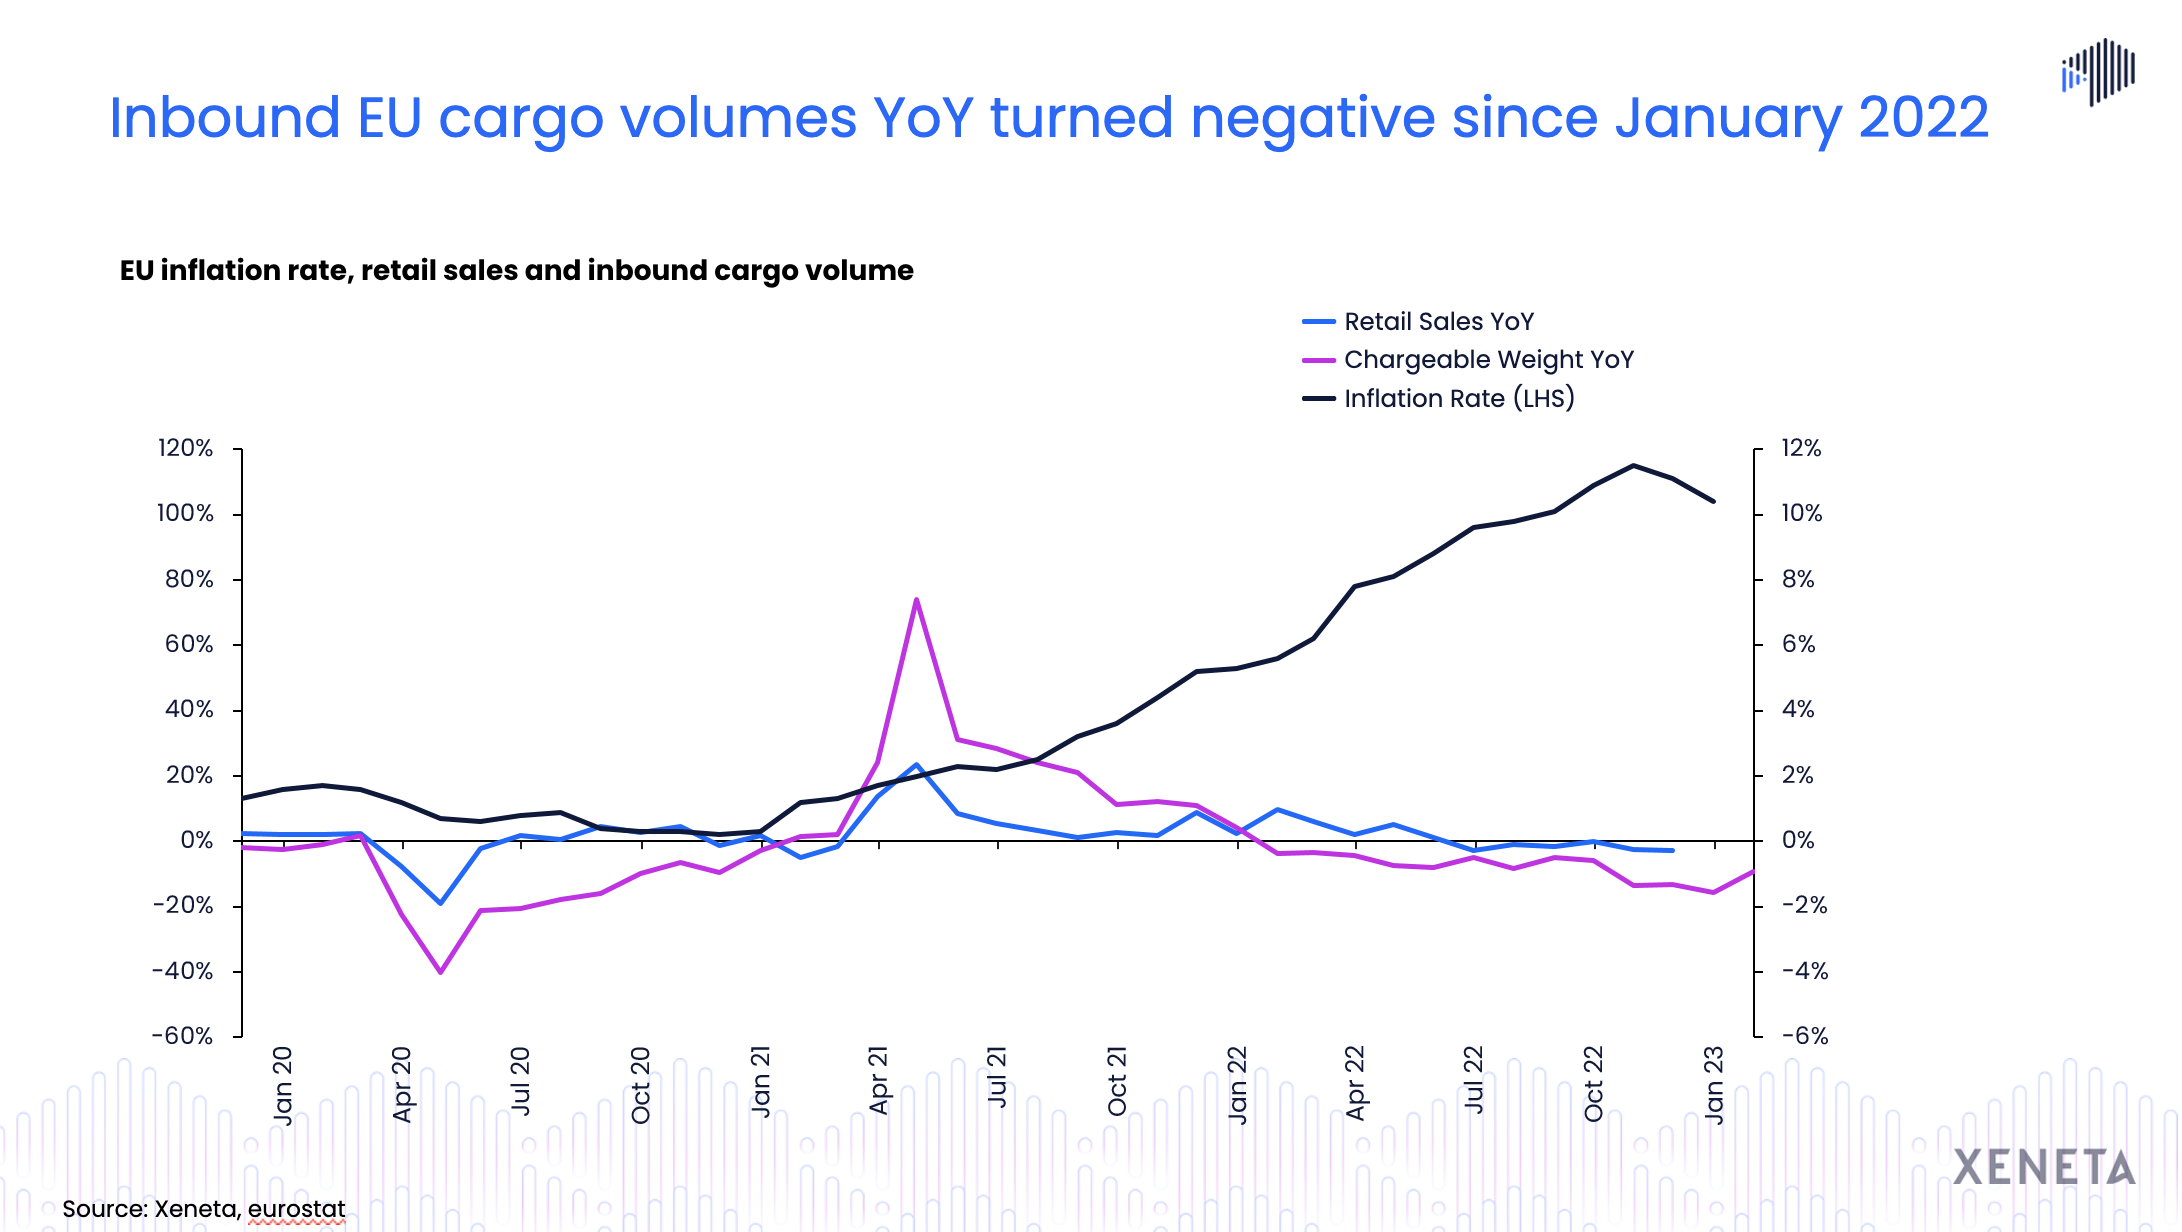
The economic headwinds have been harsh on the European markets due to the spillover effects of the Russian-Ukraine war. Also, the EU inflation has been growing by double digits since August last year. Both retail sales and air cargo volumes are affected by this market development.

If we look at the air cargo volume for inbound EU volume, it has already been falling for 13 consecutive months. In January this year, volumes dropped by a substantial 9% compared to last year.
Because of the higher cost of living, European consumers have less to spend, which is reflected in lower retail sales year-on-year. As a result, we see lesser air cargo volumes into Europe. In comparison, the air freight market into the US is slightly less affected by these trends.
Xeneta analysts continued the session by highlighting the top trades that remained buoyant in January.

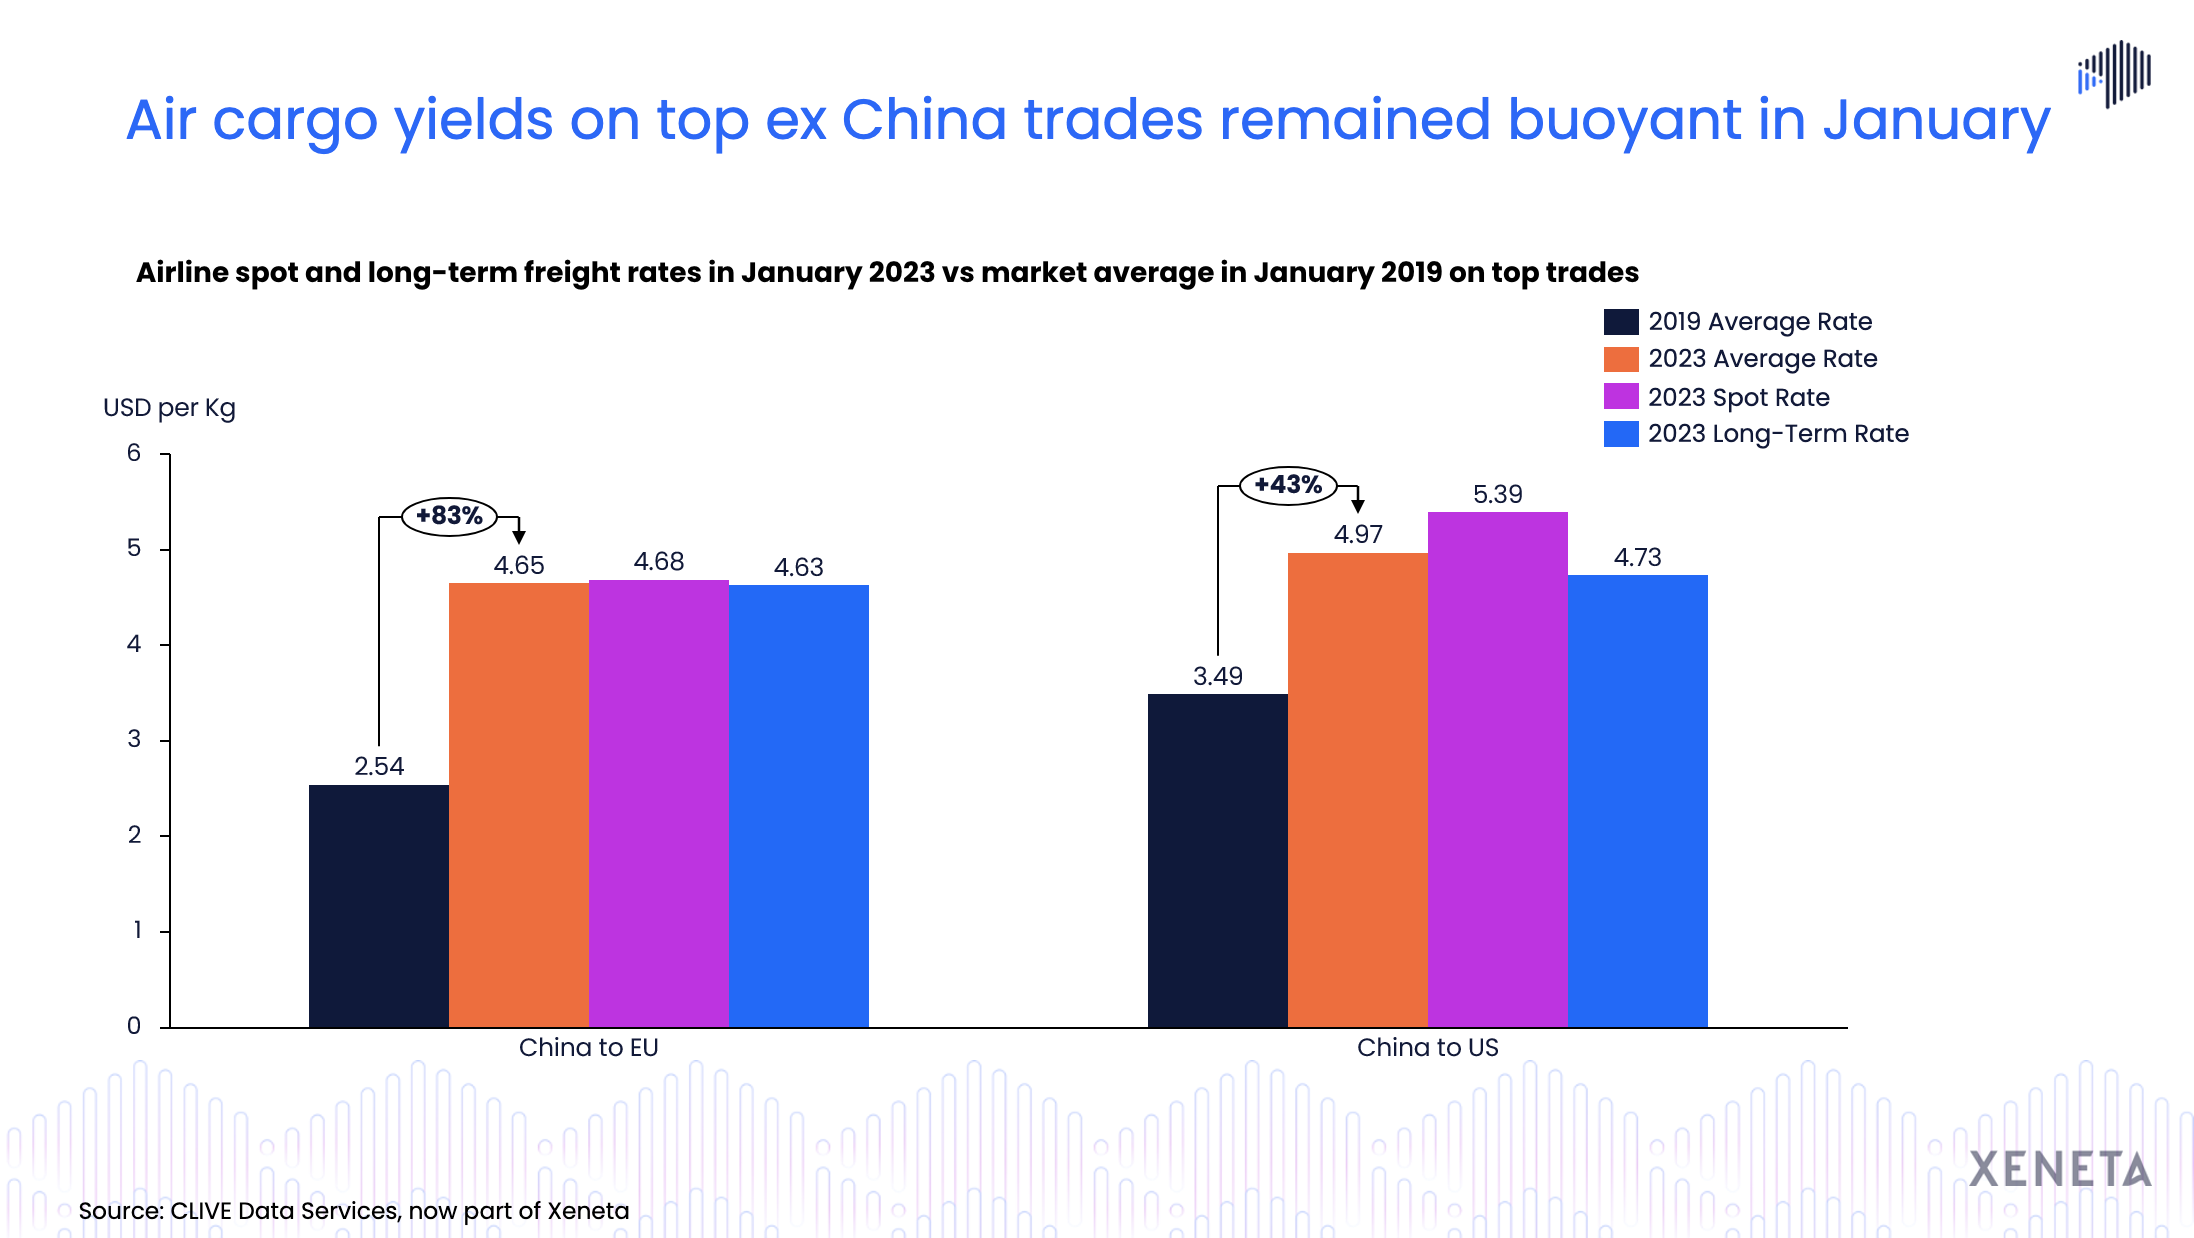
On China to Europe corridor, an early Chinese New Year has impacted the market. Even though there is more demand falling in the European market, the Russian-Ukraine war has significantly impacted the air freight rates. In January this year, the difference between long-term and spot rates almost disappeared, indicating a more balanced demand & supply in the market. This also reflects a more balanced negotiating power between freight buyers and sellers in recent months.
On outbound China to the US market, Xeneta data shows that the air freight rates remain elevated in January this year compared to pre-pandemic 2019. There is less impact from the Russia-Ukraine war on this specific corridor as flights do not need to be rerouted from the Middle East.
But due to the slow recovery of belly capacity and more resilient US consumer demand, the spot rates remained above the long-term rates. (Xeneta defines spot rates as shipments with rates valid for up to one month, and longer-term rates are rates valid for more than one month.)
From Europe to the US corridor, the air cargo capacity has recovered back to the pre-pandemic level since the summer of last year. After the initial pandemic shock, the air cargo capacity growth fell more sharply than the air cargo demand growth. However, the situation has now reversed., And in the summer of last year, we saw the fully recovered capacity back to the pre-pandemic level. And
during this time, the gap between supply and demand growth widened.
As of January this year, we see positive growth in the demand loss streams, and the supply growth is still above the demand growth. So the question arises, why are the rates not falling faster if the load factors are substantially lower than last year?
In addition to the increases in cost structure, airlines are back to their winter schedules and hence are flying fewer passenger flights, taking capacity out of the market again. This is putting additional pressure on the market and most likely explains why we don't see a free fall in rates similar to what we have witnessed in the ocean freight market.
Xeneta experts say February will be an interesting month to watch out for, as there might be a few surprises.
Want to learn more?
Watch the latest 'State of the Market' webinar on-demand and learn how you can take a competitive stance in this weaker market using reliable market insight.
Missed the LIVE session? Sign up to get the full webinar recording.
.png)


