


In our July quarterly webinar, Michael Braun (Director, Value Engineering and Head of Advisory Services at Xeneta) reviewed four of the biggest ocean trade lanes worldwide. He presented current market information and use cases on how to apply market intelligence. He covered our latest product launch, Xeneta Shipping Index (XSI™) which is an index‑based solutions. Additionally, Michael reviewed the effect of general rate increases (GRIs) on short and long-term freight rates and what you should watch out for in the next half of the year. He shared key insights on how oil price rise has affected freight rates and which trade lanes can expect more volatility in the future.
Webinar - July 2018 Ocean Freight Rates at a Glance Webinar
- Presentation transcript - : Read below (or download full transcript in PDF format)
- Live Q&A session: Read answers to common questions from the webinar
Presentation Transcript
Martin Thomassen: Hi, everyone. We're very happy to welcome you to this July Ocean Freight Rates at a Glance webinar. I'm Martin Thomassen. I am the Customer Success Manager here at Xeneta. I'll be moderating today's webinar and joined by Michael Braun, who is the Director of Value Engineering and also head of the Advisory Service here at Xeneta.
The goal of today's session is to bring you, as a listener, some insight on some of the bigger ocean trades worldwide and also shed some light on how you, as a procurement professional, potentially can utilize our information in your line of work.
Michael Braun: Thanks. As most of you are completely new to our company, we will give you a quick overview on what Xeneta is and our key statements, our main goal and mission statement.
Today, we will go into a couple of live Xeneta rates from our platform to show you how we present our market information, the kind of use cases you can profit from, and also a reference to our latest introduction of index‑based solutions.
Starting with what is our goal, to put it in one sentence - We would like to be the platform, the source which is providing the most accurate ocean freight benchmarks to support everyone who is linked to ocean freight procurement, and to help bring transparency into the industry with a lot of volatility. This is our main goal, and all our solutions are guiding to this one sentence.
What are we today? We have been founded in 2012 by two former Kuehne + Nagel managers. Our headquarters are situated in Oslo, and we have now grown up to an established company with over 60 employees with several offices around the world.
The base of our information and where our customers profit from is our rate database of around 65 million contracted rates and contracts on the Ocean Freight market pure port to port, which we have now delivered throughout the time from all our customers, which are mainly either shippers, BCOs, or smaller shippers as well as freight forwarders.
I'm proud to say that yes, a vast majority of the top 10 freight forwarders in the world are now working with us. This has now led to this extensive database. Just so that you get an idea about the actual scale - at the beginning of this year, we were at around 35 million. Another 30 million of current rates for 2018 have been entered in the system just within six months.
We have now a constant influx of several million of contracted rates pouring into our database from our vast customer base all around the world.
It now leads to around 160,000 port pairs, which enables us to bring profits to most of our customers and enable them to have an overlap of their own networks, in most cases around 90 to 100 percent. What is important to state here, especially compared to a lot of other market providers of market data is that our data is updated in real time.
We are not only publishing weekly data, or monthly, or yearly but that it's really a 24/7, real‑time platform. Constantly rate data is imported by our rate management team, and then on the other hand published on the platform. To say that we will also have today a look directly into rate information, this is just from today, and also allows us to review six, seven months of this year already.
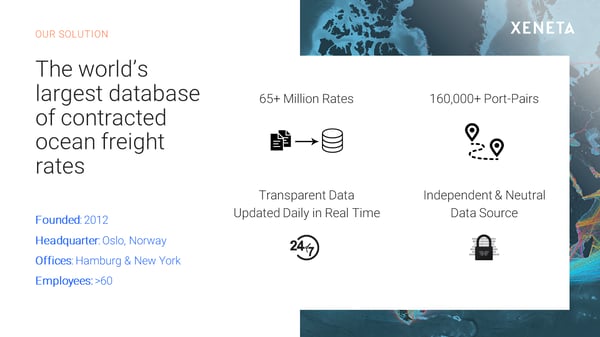
Then finally, it's also important as we serve all parties within the ocean freight industry, we are an independent, neutral source. We don't belong to any carrier. We don't belong to any freight forwarder.
Our shareholders are all just from the tech side, from investment side, but not at all from the transport industry or related in any way to the logistics industry because we really want to bring transparence into the industry independent from any kind of stakeholders so that everybody can profit from it.
You will later see if our solutions that we directly aim and better link all of their parties within the ocean freight industry. We have now established a level that we are also a trusted source for quite a lot of the specific logistics news. You can find our publications in a couple of press releases as well as the kind of trends, what you see here on that specific slide.
Just to sum up, what are we doing? What are the ways our customers use Xeneta for ? We collect contracted‑rate information from our customers who may be freight forwarders or shippers. Usually the final result of global tenders from them in Excel.
The data is collected and processed by our rate management team in Oslo, which is now around 15 people working solely to handle this kind of massive data, making sure that it's displayed correctly on the platform, and then handled electronically. In that way making sure that all the rate information published is up to date and is without any data mistakes.
Our customers are then using it for several use cases. Of course, the most important one, the one which we also have a look at today is monitoring the market development, looking at the volatility in the market and just to watch the latest developments if the markets are going up or down so to get a very good overview on what is currently happening.
This also enables them to benchmark their own preferments.
As you have such a wide independence picture from a third party, you can then also measure yourself very well and identify gaps and best practices which we then also share with our customers in customer summits once a year and in addition to quarterly webinars a little bit more in-depth than the one which you are listening in today.
Our customers then use such information also for their own procurement, target setting in the next round, preparing their RFQs, and so on, also answering rate information for themselves. They also use us as an established third‑party reference for their own reporting towards higher management on all aspects and all levels.
That's not the only case. As I've already said, we are also working with freight forwarders together. They do that on a little more extensive level because they use us for their daily procurement as they are not only running global or quarterly tenders, but they need to be up to date every day. They take us a as a third‑party measurement as well.
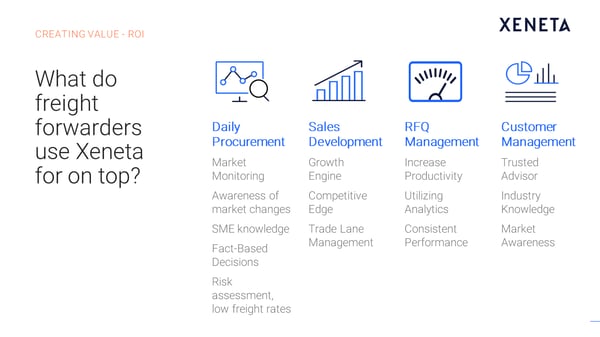
They also use us then in the same way to either identify future sales opportunities, showing where is good or bad performance or where you are not active at all. Then you can take us as a cross reference. Also, use us to quickly answer numerous RFQ events at least for the first round so that they don't need to suppress their own pricing engine.
That they can just use our reference rate for answering the first requests as well as then, of course, specific requests from their own customers especially in 3PL or 4PL. Businesses are also like index‑based contracts, they use our market information as a reference to prove that their procurement performance is very well in line with the market and that they are doing a good job.
That's overall a little bit an idea on what we are doing with our customers. We're always happy to share these kind of use cases, especially because they show you that there are a couple of potential profits you can take out. Some are looking more for performance evaluations. Others want to be up to date with the market development.
There are several probabilities how to use this in the best way. That's why we always want to mention that yes, a lot of customers use us in very different ways. Now as this whole webinar is of course going concretely into our market, I would like to switch over to what we then concretely deliver for our customers.
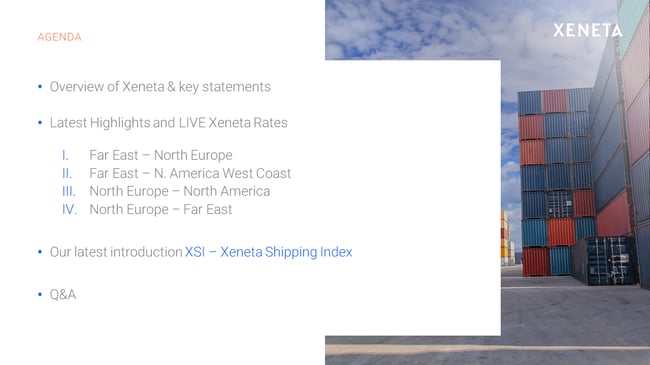
For this example, we have decided to show the rate levels on the four most important markets in the world just to give you a little bit of an indication on how you could use our platform and the market intelligence out of it.
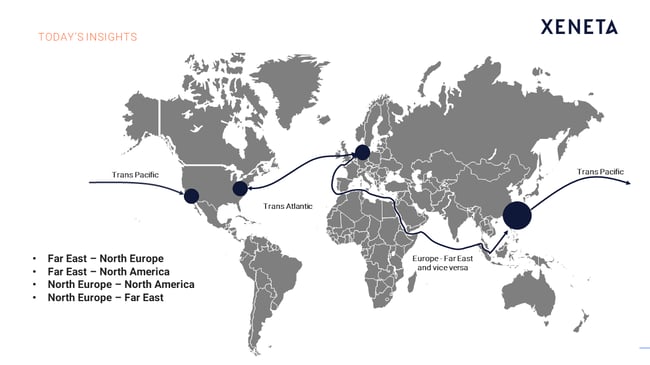
Namely, it will be two trades out of the Far East to Northern Europe and the Transpacific as well as then two trades out of Europe towards North America over to Transatlantic as well as then to the Far East. That should give you a little bit an impression on how you could use our platform for either your daily procurement or as well, for your strategic decision making throughout the year.
For that thing, I will now directly switch into our platform, just right now for a sec. This is now a typical example of one of the different regions, what we are able to show you. What is important to be mentioned is that no matter at what point of time you start becoming a customer, you will always get access to the full data along and the full history.
You really get a good overview on what you see on the market development. When we talk about market development, there is one important aspect which also differentiates us from a lot of other market information providers, is that huge, extensive amount of data being delivered either by shippers, as well as freight forwarders.
We can display two different markets at the same time, meaning the long‑term market on the one side, which is displayed by the blue line. Namely, yearly tenders, quarterly tenders being brought in by our shipper space, who usually contract full tenders.
As well as then the spot market, which is for hundred percent, only delivered by the freight forwarders, and consists of the typical short‑term rates, which are handled on an everyday basis.
Of course, by displaying both the markets at the same time, it gives you also a very, very good correlation on how the short‑term and the long‑term market are behaving together, and in what way the long‑term market is depending on the prior short‑term development.
You are then able to display the kind of time range you would like to show. For today's session, I have now just chosen the last 18 months to give you a little bit of an overview. Of course, we differentiate for the equipment. 20’ and 40’ are not calculated together. We are not talking about average TEUs, but specific rate levels for the various equipment types.
As well as then also going into special equipment with reefer and tank containers as well. The next thing, is that the rate levels, what you see here, can be displayed according to your corresponding processes.
Depending on if you have a free onboard in good terms, or if you are having intra sites related transports, you are always able to display it in the way you need it for yourselves. Either with TAGs included or excluded on any site you need it, so that the corresponding port‑to‑port benchmark rates are definitely displayed in all of the processes you need it. Then that's our latest feature. You can really drill down.
Not only seeing all our rate levels, what we have in the database, but going into only the last three months. Meaning that on a single day, the average, which is then calculated here, like the 1,472, is then only made up from contracts which are only valid within the last quarter for this specific day.
You can be sure that the development displays rate levels which have been only recently tendered. We are not taking into account contracts which have been, for example, contracted two years ago, with a completely different market situation.
The data you see there is brand new, and just comes from the latest tenders being just concluded. That's pretty much a little bit the philosophy of our platform. Of course, there is much more to see, different screens, details Excel screens, detailed lists, where you can do your own calculations, also calculate your own budgets.
For the time being and for today, that's the only screen I would like to explain you. If you would like to see more information for other screens or proper demonstrations, even with your own data and your own contract information displayed as well, please feel free to contact us, especially our salespeople. They are then happy to set up individual web demonstrations for you and your company.
Finally, perhaps just blended in, we are also not only displaying average market levels, but also the market low and the market high. You always get both for the short‑term and the long‑term market, the whole bend of the market, how we perceive it today, so that you can really evaluate for yourself how good your performance is, and if you are satisfied with the kind of strategic goals you have previously set.
Now, going into it and displaying a little bit of the use cases, I would like now to start with the trade out of Asia, which is by far the biggest one on the world when it comes to our customer base. This is now really a high‑level view, because we only want to show you general trends and general information.
If you are a customer and as we have already mentioned our 160,000 port pairs, you are able to display it on a specific geographic level. Not even going down only on a country level, but really going down on a specific port pair. If you are looking for the port pair from Shanghai to Abidjan, from Shanghai to Hamburg, or whatever, you are always entitled to do so.
Of course, for today, and not to drill down in 150 screens, we stay on a high overall generic level. In principle, you can access to all the port pairs, what we have in our database, then fitting to your network, so that you really get the port‑to‑port related information applicable, as long as we have enough overlap to display it. Now, we are able here to do so for 160,000 port pairs.
Now, I would like to just say for what reasons are our customers using it. It's quite easy, especially on that screen. As you can see, the trade‑out of Asia is mainly triggered, especially on the short‑term market, by general rate increases. From time to time, the carrier base tried to increase the rate level and set it on a new level by implementing general rate increases.
Then it will always be the questions, do they hold, or do they vanish again? Do we have a downturn trend, or do we have an upturn trend? Usually, what we see is that this kind of corresponding trend on the short‑term market is then also followed by the long‑term market.
There's a little bit of a delay, just since, of course, the contracting in the long‑term market with the tenders always takes a little bit of time with the negotiations going on. In general, we can really say that now, when the short‑term market is going up, the long‑term market is following, as well as then the other way around.
For example, the situation, what we had towards the end of last year. As you can see then here, the short‑term market was really on a downward trend, up to the end. The long‑term market then followed in due course. Since then, the market had been quite stable, until the beginning of this year.
Then we saw, again, a significant rate increase up to in the line with Chinese New Year. As you can see, for this year, this upward trend around Chinese New Year, was only working on the short‑term market. There was not that much going on. The fight for capacities was still ongoing. We couldn't see any kind of influence on the long‑term market.
All the global tenders, more or less, ran within the same situation. Even then, in the long run, expected a decrease of rate levels, because after Chinese New Year, a lot of over capacities had been there. Then we have seen quite a significant downward trend, which also pretty much distinguished our last quarter's webinar three months ago.
At that point of time, end of April, there was literally no sign at all for a change of the market situation. It was even the kind of risk that we see a further beating for market shares. Then yes, the situation changed a little bit due to the rising oil price, the situation we have seen already at the beginning of the year.
Then of course, the rate levels had to go back on a higher level again, because the carriers had to cope with the higher costs. That was the situation, what we have seen so far throughout the last quarter, that most of this kind of an increase has now come again, due to the fact of the bunker price increases.
Now, you can see that of the latest contracts in July, we already saw an increase on the long‑term market again. Now, it will be interesting to see if this is a new trend starting up, or if it just starts on that level. As the increase on the oil price now has also come to an end, we are now back at a steady increase of 10 to 20 percent. This is also in line with the rate levels.
Depending on how the oil price further goes and depending on any other political situation, that's the situation for the moment. We expect it to stay like that, at least towards the rest of this year until anything unpredicted happens.
Then, of course, there will be probably more volatility coming in, especially when now the first 10 routes for next year start, as we then have to cope already with the new introduction of the low sulfur later in 2020. That will already be then touched by the 2019 tender round, which is coming up. That's why we will most probably see changes in the rate level again latest towards the end of the year.
Of course, looking at the political situation at the moment, this can also happen before. This is what we see at the moment on the Transpacific. It had been quite a stable situation around the TPM. We then saw a significant downturn after the TPM, but then that trend has now also stopped with a lot of recent general rate increases coming into place.
We also expect that this will have an influence on the rate level on the long run. This is also something which needs to be closely focused, especially with the situation when it comes to the tariffs now, and the potential tariff war coming upward.
This will, of course, also have a significant impact on the ocean freight rates, as we are heavily dependent on globalization in general, and of course, the trade growth in specific. At the moment, we clearly see an upward trend on the Transpacific, at least on the short‑term market. There have been now three successful general rate increases.
We would expect it to arrive on the long‑term market. As we have already said with the uncertain political situation, it's very hard to say how this market is going to behave in the near future. There are a lot of things going on also with the capacity allocation. It's definitely advisable to follow this trade closely.
This is also the kind of thing, what our customers then do on a regular basis, even if they are not in the middle of their tender. As you can see, a lot of things are happening. Also, then, yes, sometimes showing short‑term or being below long‑term market, as well as the other way around. These, of course, always have an influence, especially on the freight forwarders and their cost and pricing structure.
In that way, yes, a lot of our customers just follow us on the regular level to be aware of these kind of market changes on a constant level. Same applies, of course, also on the Transatlantic. Here, due to the hike on the oil price, we also saw a significant increase starting in April this year, with the latest significant increase already coming in place now.
Here, it will be very interesting. This is just the start of a normal increasing process, or if just we've seen a correction due to the oil price cost in that regard. That's why same thing for Transatlantic, also a lot of things are happening now. It had been quite stable throughout the last year, hardly any changes, but now this year, it definitely looks like something is going on.
That's one of the markets where our customers are looking more closer, which is, of course, interestingly, exactly the other case around from Europe to Asia.
This was the market where in last year, everybody in the business will remember we had a huge spike, and where our customers were extremely happy to get information like this to prove their own internal people that yes, this market is going crazy.
That's why we have to also accept an increase on the long‑term market. That is definitely information which was very important for them last year. There was a lot going on and they were very happy with our market information. Of course, when we now talk about this year, the market has been extremely stable throughout the last 9 to 10 months.
In this regard now everybody would say, "Yeah, well, that's a very easy and good market." Then on the long run, you never know what's going to happen. That's why our customers, of course, stay close on the tab, on the tips, in order to be sure that they don't miss any kind of recent development.
That's also the last point I would like to refer to today, after going into these four detailed markets at a glance, is to also mention a little bit of our last index‑based solution. One of the points, what we often get asked by our customers, also like the freight forwarders, is especially in the market situation, what we are having now.
If it's such a constant rate level, why not go in on a long‑term contract? Why not fix in that rate for two to three years? Which is, of course, on the one side, in the interest of the shipper, because then he has a price continuity. On the other side, the freight forwarder could in theory also fix the customer relationship for a long‑time frame.
Of course, when you are never sure that there aren't any kind of rate hikes coming in again, which would, of course, completely destroy the profit calculation of the freight forwarder, you need to have some kind of measures to handle these kind of freight deviations. With this regard, I would like to mention our latest solution - index‑based contracting.
 Currently, we are already having the first customers where we now use our indexes to use it also for direct contracting between our customers. We have shippers and freight forwarders both working with us together.
They have now decided, to cope with the volatility, which is just natural in the market, that they are not running constant tenders all the time, but that they use our index rates as the proof, reference, to go for a base for their own individual contracts.
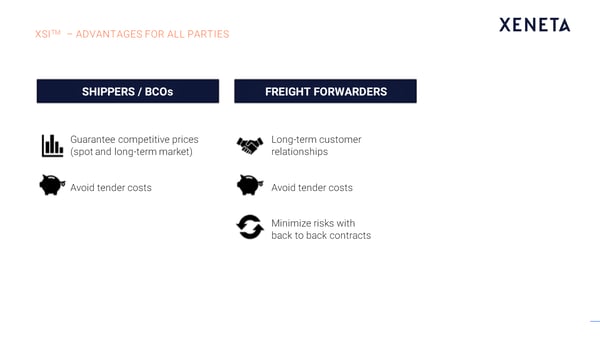
So that they can have long‑term customer relationships, long‑term contracts, but at the same time, at the guaranteed fair market price, which is actually delivered by us as an independent source of information.
These kind of index‑based prices then gives our shippers the possibility to be sure that they always get competitive rate levels, while at the same time, they can save the massive amount of workforce they usually use for their tenders, disturbing them for their other important supply chain‑related task where they usually have to follow on.
As well as with the freight forwarders, that they can ensure long‑term contracts with their customers, but at the same time, minimize the risks. That they need to go on long‑term contracts when they are not sure if they can refinance them together with the carrier base. If the market is going up, and they are stuck in a long‑term contract, then it would be, of course, not any more profitable for them.
That's why usually, when you ask for long‑term rates, you always get a premium due to the fact of risk insurance they need to cover. With an index‑based pricing adjustment factor, this thing is not necessary any more. Hence, they also save the additional effort of tendering.
Yes, we are very happy to have this specific product on board now in addition to displaying the market intelligence. A lot of information in a very short time, but I hope it gives you a little bit of an indication on what we are able to deliver.
As a final slide for today's session, before wishing all of you a pleasant summer, we just want to announce that we soon will launch the Xeneta air freight benchmarking tool that will look almost identical as the ocean freight product.
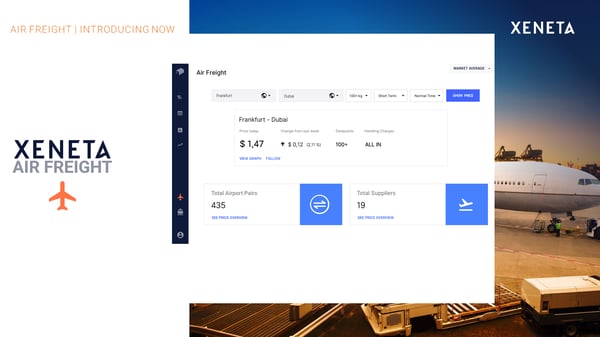
If you want to know more about this product, feel free to send an email to info@xeneta.com, and we will put you in contact with the right contact person. With that said, Michael, thanks again for sharing your knowledge here, and also answering all questions. Wish all of you a pleasant summer ahead. Thank you very much.
Q1) How does Xeneta differ from other freight indices, for example, the SCFI?
A1) Two very easy reasons. The first one is, it's daily and not weekly, which is important for freight forwarders. The second one, which is the main driver for shippers, is that we also are to display a specific index only for long‑term contracts, meaning typical tender rates, while the SCFI is a pure spot market index.
You have seen the graph before, the Far East to Europe, you can say that the orange short‑term line is more or less the SCFI and the blue line referring to long-term is an addition with Xeneta. We not only display the average, which is the SCFI, but also the market low and the market high, and the whole span of the spot market. There are different angles and dimensions where we are far more into detail.
Q2) Can you predict rates? If yes, based on what?
A2) No, we can't predict rates. The only thing what we do is giving a future, like an indication or averages on what our contracted rates for the future are going to look like. Which means we get a constant influx of rate levels, we of course now also already get contracts, which have a contract start of, for example, of first of August.
For the customers willing to have this add‑on, we are already able to give them the indication on how the averages will most probably look like on the long‑term market for August, because we already have rate input for August.
Everything else is crystal ball, because everything else is depending on the situation on the short‑term market. This is actually happening just right away at the moment. There is no way to foresee what the market is going to be like in two to three months.
Q3) How do you collect the data from freight forwarders and shippers?
A3) For both in the same way, usually on an Excel. Only on massive vast amount of data we use directly API connections. Usually, it's on Excel even with most of the freight forwarders. Just the final contracts with their customers, from their rate sheets.
Q4) Is there a way to compare big volume shippers versus small ones?
A4) We don't have a specific driver here, because we can clearly see that there is not really a correlation. As we know the shippers behind in our database, we do not able to display that information.
We have already made these kind of analysis, and you cannot say that there are big shippers' rates and small shipper rates. You can say that there are good procurement rates and a little bit more with room for improvement. It's not related to the volume, as such.
Q5) I would like to know if Xeneta has a database to South American ports.
A5) Definitely. As I said, 160,000 port pairs. I can't tell you how many port pairs are going to South America, but I can tell you that there are many more ports in than I have ever heard of. Yes, we have a very extensive network to South America, even out of South America as well, at least out of some production centers.
For that reason, for specific coverages analyzers, there's always the way that potential customers provide us with their network. Then we are happy to provide them with a ballpark figure on the coverage before they even sign any kind of contract.
Of course, we can sign NDAs, non‑disclosure agreements, if necessary, but we are happy to share the potential profit with them before they even become a customer, so that they can easily calculate the business case for themselves. There is nothing to be hidden in that way. We are happy to promote our capabilities of coverage.
Q6) The benefits of this system are out of the question. I am wondering, however, about the accuracy of the rates. Rates comes from forwarding carrier and shipper side. What is the incentive for a client to input that the rate's accurate, and share this information?
Michael: There can be two perspectives here. The first one is, mistakes can always happen, especially with people handling large amounts of data. Talking about Excel, everybody knows the risk of that. That's why we have a huge team of experts which are checking this kind of rate information before.
We have a lot of arithmetic behind. We have a lot of different algorithms running over it so that we can identify outlying rates, and also see if something is going wrong. That's also the reason why when we display averages, or even the low, we are not going on single rates, we always go in corridors. For example, a low all this is represented by the last 2.5 percent.
It's also a percentile, making sure that not a single outlier is deviating everything. We are doing extensive tests on this. I would really say that we are absolute experts on that. I can tell you that it's highly professional, even for the freight forwarder as well.
They really handle millions of freights as well, some of them even tell us that we have the best practice, or that we are at least matching up to their own standards. You can be sure that the data we handle is on the same level of professionalism, like the carriers the freight forwarders do it themselves.
We only display the reality of these contracts out there. In that way, we are very confident, super professional about it, and invest a lot of money for it, talking about the whole team sitting in Norway.
###
If you missed any our webinars – or simply want to refresh your memory – you can access all of them on demand here.
See you next time!